Analysis of Depression Disorder with Motor Activity Time-Series Data Using Machine Learning and Deep Learning
Analysis of Depression Disorder with Motor Activity Time-Series Data Using Machine Learning and Deep Learning

G. Kalyani, M. Suneetha, B. Janakiramaiah, and Gopi Battineni
Abstract The future of the healthcare system is being altered by new technology developments. Depression is a neurological condition that can cause signi!cant emotional suffering. The way of brain working can change how much of an impact it has on the body. A person with depression typically has a low mood and may feel depressed or hopeless all the time. In response to loss or tragedy, depressive symptoms may appear brie”y. However, if the symptoms persist for more than 2 weeks, it may indicate a signi!cant depressive condition. The incidence of major depressive disorder is 350 million people worldwide (MDD). Historically, conventional techniques have been used to identify depression symptoms. Recently, research has started investigating the relationship among psychosocial characteristics, like quality-of-life scale, and mental health, that helps to identify and predict MDD earlier for better treatment. Finding the elements that contribute to depression may inspire new research and therapeutic approaches because depression is an illness that is increasingly posing a signi!cant community health threat. In this work, we have provided comprehensive approaches to handle and examine the time series data and better understand the association between depressed aspects connected to physical activity in daily life using machine learning and deep learning techniques. There seem to be more direct links between various physical conditions and depression. These could end up being particularly interesting in terms of etiology. The two
G. Kalyani · M. Suneetha
Velagapudi Ramakrishna Siddhartha Engineering College, Vijayawada, Andhra Pradesh, India
B. Janakiramaiah Prasad V Potluri Siddhartha Institute of Technology, Vijayawada, Andhra Pradesh, India
G. Battineni (*) Clinical Research Centre, School of Medicinal and Health Products Sciences, University of Camerino, Camerino, Italy e-mail: gopi.battineni@unicam.it
https://doi.org/10.1007/978-981-99-6637-0\_2
best examples are probably heart disease and stroke. The experimental results support the hypothesis that the change in the physical activity of daily life for a sequence of days is an indication of unipolar depression.
Keywords Motor activity · Unipolar · Bipolar · Depression · Physical activity · Random forest · XGBoost · LSTM
1 Introduction
According to the World Health Organization (WHO), health is a condition of total physical, mental, and social well-being and not merely the absence of disease or disability. More than 350 million individuals worldwide experience depression, which has the potential to worsen into a signi!cant health issue, especially when it lasts for a long time and is moderate to severe in intensity. Depression may be extremely painful, interrupting daily activities like job, school, family, and relationships, as well as economic and emotional ones. In the worst instance, it may result in suicide, which accounts for about one million fatalities each year [1]. The child and young adult populations in Latin America have a high incidence of psychological problems; about 20% of these populations have disorders that call for the assistance of health services. However, this number is understated because adolescents try to conceal and hide their dif!culties from adults and lack the con!dence to obtain medicinal frameworks [2].
Depression is a psychological condition that is inherently characterized by a depressed mood, a lack of interest and pleasure in the good things in life, and exhaustion. These symptoms degrade their quality of life and cause problems for those who experience them in their families, places of employment, and social settings [3]. Depression can begin with key symptoms which do not involve mood changes or even cognitive performance, making it simple for anybody to experience depression [4]. Depression can also occur without regard to age, sex, or socioeconomic status. Once depression has been diagnosed, the patient must receive medication that reduces the dif!culties that this illness brings on. The fact that depression might be resistant to some medications, though, is one of the dif!culties that have emerged. In treatment-resistant depression, the effects of recurrent transcranial magnetic stimulation (rTMS) on cognitive ability !ndings suggest that this noninvasive brain stimulation can be utilized as a method for treating depression that has not responded to medication [5].
Patients’ reports are used in traditional approaches to track depression in unipolar and bipolar patients. However, bias is frequently seen in this kind of monitoring. According to Sedano et al. [6], changes in behavior and perception of the outside world are also evident. Ecological momentary assessment (EMA) is an alternative to these reports as they capture behavior, emotions, and other types of activities that occur in real-life circumstances. As the number of wearable devices such as smartwatches and smartphones with motion sensors, such as gyroscopes and
accelerometers, increases, EMA measurements can be performed almost instantly, allowing for the expansion of the public’s availability of mental health services without the use of new, specialized devices. As an example, various strategies to combat mental illness have used cell phones and similar technology. By using two main strategies—implementing human–computer interfaces for therapeutic support and gathering pertinent data from individuals’ regular lifestyles to track the current situation and progression of their mental problems.
In the discussion of how mobiles can aid in the treatment of psychological disorders, researchers concentrated on two key strategies including incorporating human–computer interfaces for therapy support and gathering pertinent data from participants’ regular lifestyles [7]. Using a smartphone as a clinical medium showed that psychological therapies can lower anxiety [8]. Data on psychiatric patients’ use of and interest in using mobile applications to track their mental health symptoms proved that 50% of patients across all age-groups expressed interest in using mobile apps to track the condition of their mental health [9]. Mobile phone sensors for the identi!cation of human behavior traits, activity detection at various levels of activity abstraction, and characterized health-related behaviors including sleeping and exercising [10].
Applications in numerous sectors, including activity recognition, are developed using devices with sensors that can obtain contextual information [11]. Finding mental diseases can be aided by activity recognition. Motor activity data is used to model the patterns of schizophrenia and depression disorders [12]. Many apps have been suggested to provide sad persons with self-help. Although these apps enhance some areas of cognitive behavioral therapy (CBT) or behavioral activation (BA) evaluation, still they are debatable that highlighting the need for superior scienti!c, technological, and legal expertise [13]. Two intriguing reviews on mental health disorders used many sensing layers and sensor data to model behaviors and provide associated mental health states [14, 15]. Data from social media, such as social networks (such as Twitter), online forums, and public surveys are additional ways to physical sensors. Through the monitoring of these passive data about the subject’s activity, these approaches attempt to detect depressive moods. All of these methods necessitate direct patient engagement, which may result in inaccurate !nal diagnoses. Therefore, a technique that reduces the requirement for subject contact is necessary to prevent outliers, who purposefully overfeed data.
Daily life patterns and time series of repeating biological rhythms should be regarded as complex dynamical systems. Simple linear models are rarely able to classify complex dynamical systems. Therefore, the typical approach for assessing and rating motor activity recordings has been to use mathematical techniques from the study of nonlinear complex and chaotic systems [16]. In the analysis of data from intricate dynamical systems, machine learning (ML) methods have shown encouraging results and in a long-term investigation of bipolar patients’ heart rate unevenness, ML’s capacity to uncover non-obvious patterns has reasonably reliably identi!ed mood states. Similar changes in cardiovascular and autonomic systems have been discovered in manic individuals by nonlinear heart rate variability analysis. Heart rate measurements are signi!cantly less noisy than accelerometer recordings. However, the time series of motor activity has enormous potential for a variety of ML techniques. Random forest and neural networks [17] techniques have demonstrated potential capabilities for temporal series data of activation. Millions of parameters in a mathematical model called a neural network constantly adjust themselves to maximize performance. As a result, it is challenging to understand the lines of reasoning. Some techniques do, however, provide some interpretation of neural network internals. There is doubt about a black-box system that generates calculations without explaining the !eld of medicine [18]. However, results from high-quality analyses of critical variables should be regarded as reliable, at least when over!tting prevention strategies have been used [19]. The Random Forest algorithm’s ensemble learning method resists over!tting and can be thought of as a woodland of decision trees, where different trees focus on stochastic portions of the data. Predictions made by decision trees are transparent and comprehensible.
2 Literature Review
Subjective observations along with clinical rating measures that are semi-structured are the current methods used to evaluate mood episodes in affective disorders. The assessment of emotional symptoms should be done using objective approaches. A change in activation is a key indicator of both bipolar and unipolar depression, according to research on motor activity, which is a neutral remark of the internal physiological state represented in behavioral patterns. In comparison to healthy controls, the depressive state is frequently linked to decreased daily motor activity, greater activity level variability, and less complex activity patterns. Contradictory motor activity patterns, resembling those seen in manic patients, have been seen in a few depressed bipolar and unipolar individuals. A thermodynamic model of depressive disorder has been developed, and it is claimed that depressive issues are diseases of energy instabilities. According to a simpli!ed version of the paradigm, two energies emerge from a shared zero point of motor-retarded depression that has been down-regulated [20]. The !rst excited energy is the awakening of overexcited symptoms, such as overstated self-esteem and ampli!ed goal-directed behavior. The second agitated energy is related to heightened internal tension, anxiety, and restlessness. A manic state appears to have enhanced levels of euphoric and agitated energy [21], while one out of every !ve depressions, regardless of polarity, appears to have agitated energy. These !ndings provide evidence in support of the thermodynamic concept. Unquestionably, motor activity is an expression of daily social rhythms that are repeated in connection with a biological pace that cycle every 24 h and are interlocked with multiple ultradian pace sequence that last from 2 to 6 h [22]. Biological pace patterns that are out of sync are proposed as key signs of mood episodes [23].
In various research on the prenatal detection of depression, ML techniques have been employed. N-gram language modeling and vector amalgamation with topic analysis were recommended to classify the anxiety levels of created emotional
features [24]. The bag-of-words embedding procedure is a way to identify depression using the Twitter dataset [25]. A supervised ML algorithm’s effects on measuring predictors for identifying post-traumatic stress chaos were explored in [26]. A deep neural network approach to examine depression in social media like Twitter was put up [27]. Convolutional neural networks were utilized to contrast several models and they depend on linguistic metadata for the prediction of emotions [28].
Major research studies on revealing of depression rely on textual data or persondescriptive techniques that select elements from social media posts. Textual-based featuring is used to highlight the linguistic components of social media content, including words, parts of speech, N-grams, and other linguistic traits [29]. The descriptive-based featured technique places a focus on subject descriptors, which may include age, gender, employment status, income, drug or alcohol use, smoking, and other details speci!c to the subject or patient [30]. In [31], authors performed research that uses supervised machine learning classi!ers’ prediction capabilities to study how emotions interact. They used categorization techniques to group messages on social media that dealt with depression. For the bag-of-words features, Trifan Alina et al. in [32] proposed a rule-based model utilizing a Tf-IDf technique to identify sadness from the Reddit social media platform. Early depression diagnosis using historical tweets from Twitter users using bidirectional LSTM and attention model was presented in [33].
A system for tracking emotional wellness has been created called KBRS, and it employs a deep learning model and sentiment metric algorithms are used by this system to determine which sentences have negative content [34]. A few studies examine patient behavior on social media sites using data from Facebook, Instagram, and Reddit posts by combining the discriminative power of popular ML classi!ers [35]. A method for classifying depressed people on social media platforms was presented that uses the hierarchical post-representation model known as the MGL-CNN [36]. For recognizing depression, another study employs DCNN and ANN for the examination of depressed symptoms, two models—the deep model and the shallow model—are put forth. This study blends deep and shallow models with text and video elements [37]. It comprises of the RF algorithm for scoring based depression categorization and is suggested to use text that is extracted from patient responses based on language in addition to speech signals to detect depression [38]. Study that analyses text data from college students to identify depression in college students by the DISVM algorithm is used to categorize data acquired from input and, in the end, identify depression as a mental disorder [39]. Some research uses multi-modal data from text, audio, and video to analyze the patient’s mental condition and subsequently forecast an outcome [40]. To account for the intensity of the patient’s depression, the output is classi!ed into various depression levels [36]. These are some of the techniques used to classify text, video, and audio elements associated with depression. Some models successfully predict the symptoms of and severity of depression, others do not produce adequate !ndings. Based on the aforementioned literature review, researchers concluded that there are numerous scienti!c answers to the problem of depression detection. Since there are more depression instances,
there are more treatments that have been presented, but these solutions have not yet been highly accurate, and there have been signi!cant losses.
Few researchers utilize the data from social media platforms, which might or might not be reliable [41]. There is a risk that using online tools for depression prediction, such Twitter and Reddit, will lead to inaccurate predictions of depressive symptoms. A mistake will result if symptoms picked up from social media sites online are incorrectly predicted [42]. It is impossible to assess a speci!c risk of depression if the data are inaccurate. Social media users occasionally publish depressing or sad stories, either knowingly or unknowingly, which can have an impact on the system’s overall ability to detect melancholy [43]. As a result, social media networks are not a reliable source for scholars. They frequently make advantage of an accurate database created when creating a system for detecting sadness. Researchers require a method for automatically detecting depression that is highly accurate and produces little system losses. The characteristics of audio samples, video samples, and text responses from a depressed patient can be combined to get precise results [44]. The deep neural network method makes it simple to forecast depression [45]. A depression detection system will only be created if the model has been trained and has learned all the aspects of audio, video, and text. These are literature reviews that address the issue of depression detection.
The work in this article is a reexamination of motor activity recordings from a group study that was previously reported in the article [46]. The wrist-worn actigraphy utilized in the dataset, to trace the integration of intensity, amount, and duration of movement in all directions, was used to record motor activity. At a sampling frequency of 32 Hz, movements higher than 0.05 g were captured. The result was expressed in units of gravitational acceleration per minute. Throughout the recording, the actigraph device was continuously worn.
3 Methods
3.1 Dataset
The data collection includes 23 patients with depression termed as the condition group. Figure 1 depicts an instance of data related to a single person over a day. 18 people were outpatients while data were being gathered, whereas 5 people were hospitalized. The Montgomery-Asberg depression rating scale (MADRS) [47] was used by a doctor to gauge the severity of continuous depression at the beginning and end of the motor activity recordings. The dataset also includes actigraphy data from 32 non-depressed volunteers termed as the control group, comprising 5 students, 4 former patients, and 23 hospital employees who are not now exhibiting any psychiatric symptoms. Figure 1 presents the activity of condition and control concerning the time.
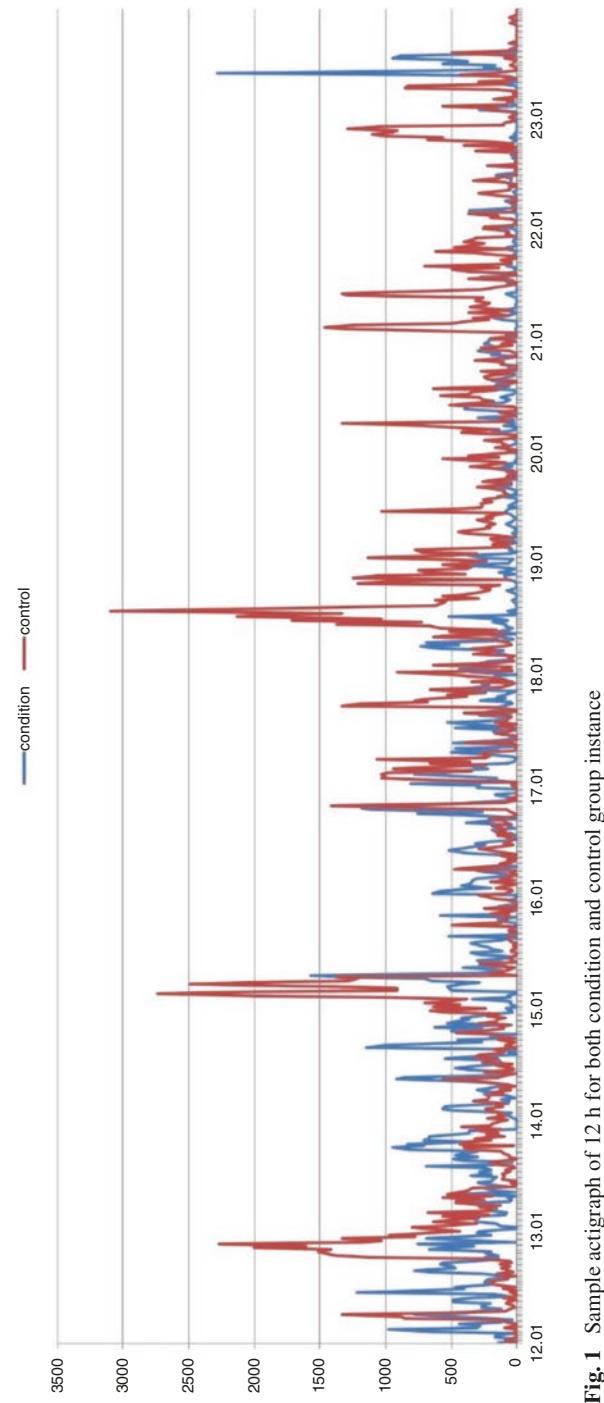
The dataset contains the data for the condition group, and for the controls. Each patient receives a csv !le containing the actigraph data that has been accumulated over time. The columns are activity, dates (the measurement day), and timestamps (1-min intervals) (activity measurement from the actigraph watch). The scores.csv !le contains the MADRS results as well. The columns are number as patient id, number of measurement days, gender as 1 or 2 for female or male, age (age in agegroups), afftype as 1,2,3 for bipolar II, unipolar depressive, and bipolar I respectively, melanch as 1 and 2 for melancholia and no melancholia, respectively, inpatient as 1 and 2 for inpatient and outpatient, respectively, education grouped in years, marriage as 1 and 2 for married or cohabiting, and single, respectively, and MADRS scores at the beginning and end of the study. Figure 2 demonstrates the total number of days that each control and condition group person are tracked for motor activity data.
3.2 ML Models
3.2.1 Logistic Regression
Similar to linear regression, logistic regression employs an equation as its exempli- !cation. To estimate an output value (y), weights or coef!cient values (Beta) are linearly coupled with input values (x). The process of making the data suitable for logistic regression includes the following:
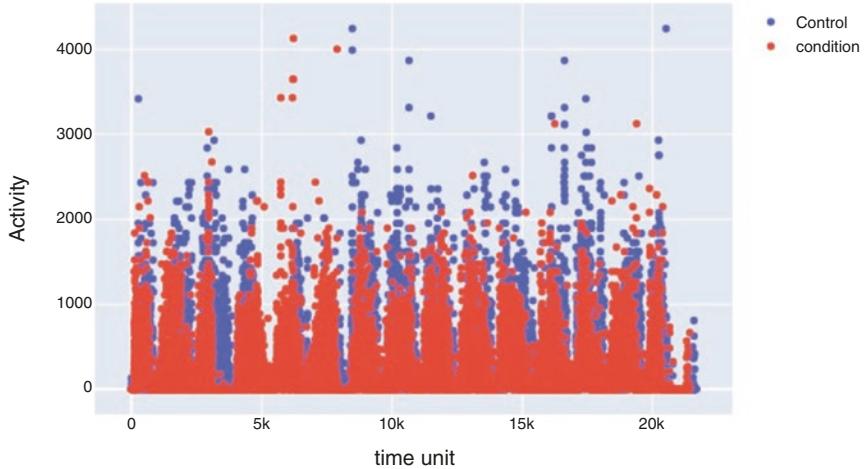
Fig. 2 Activity distribution of condition and control over time
- Reduce noise: Since the output variable (y) in a logistic regression model is assumed to be error-free, you should remove outliers and any potential misclassi!ed cases from the training instances.
- Gaussian distribution: The input and output variables are assumed to have a linear relationship. A more accurate model may be produced by applying data transformations to your input variables that more clearly reveal this linear relationship. To better reveal this link, you may, for instance, apply log, root, Box-Cox, and other univariate transforms.
- Eliminate associated inputs: Similar to linear regression, the model can over!t if it receives several extremely correlated inputs. Study the pairwise correlations among each input and eliminate those that are extremely associated.
After preparing the data, there are “n” observations and “p” feature variables in the dataset. The feature matrix looks like this:
\[X = \begin{pmatrix} 1 & \mathbf{x}\_{11} & \dots & \mathbf{x}\_{1p} \\ 1 & \mathbf{x}\_{21} & \dots & \mathbf{x}\_{2p} \\ \vdots & \vdots & \ddots & \vdots \\ 1 & \mathbf{x}\_{n1} & \dots & \mathbf{x}\_{np} \end{pmatrix}.\]
where it represents the values of the jth observation’s ith characteristic. The ith observation, xi, can be illustrated as follows:
\[\mathbf{x}\_{i} = \begin{bmatrix} 1 \\ \mathbf{x}\_{i1} \\ \mathbf{x}\_{i2} \\ \vdots \\ \mathbf{x}\_{i} \\ \vdots \\ \mathbf{x}\_{ip} \end{bmatrix}\]
The predicted response, denoted by h(xi), is for the ith observation, or xi. The hypothesis is the name of the formula we employ to determine h(xi).
In the case of linear regression, the prediction method we employed was
\[h(\mathbf{x}\_{l}) = \beta\_{0} + \beta\_{1}\mathbf{x}\_{l1} + \beta\_{2}\mathbf{x}\_{l2} + \dots + \beta\_{\rho}\mathbf{x}\_{\rho\rho}\]
where β0, β1, …, βp are the regression coef!cients Let the vector or matrix of the regression coef!cient be:
\[ \beta = \begin{bmatrix} \beta\_0 \\ \beta\_1 \\ \beta\_2 \\ \cdot \\ \cdot \\ \cdot \\ \cdot \\ \beta\_p \end{bmatrix} \]
Afterward, in a shorter format,
\[h(\mathbf{x}\_i) = \boldsymbol{\beta}^T \mathbf{x}\_i\]
The statement of the hypothesis h(xi) for logistic regression is
\[\mathcal{H}\left(\mathbf{x}\_{i}\right) = \mathbf{g}\left(\boldsymbol{\beta}^{\mathrm{T}}\mathbf{x}\_{i}\right) = \frac{1}{1 + e^{-\boldsymbol{\beta}^{\mathrm{T}}\cdot\mathbf{x}\_{i}}}\]
The logistic regression uses the following cost function:
\[J\left(\theta\right) = -\frac{1}{m}\Sigma \left[\chi^{(i)}\log\left(h\theta\left(\mathbf{x}\left(i\right)\right)\right) + \left(1 - \chi^{(i)}\right)\log\left(1 - h\theta\left(\mathbf{x}\left(i\right)\right)\right)\right]\]
3.2.2 Support Vector Machine
An approach for supervised learning called the support vector machine (SVM) is employed for both classi!cation and regression. Even if we also refer to regression issues, classi!cation is the best !t. The technique’s main goal is to locate a hyperplane in an N-dimensional space that categorizes the data points. The hyperplane’s size is depending on the number of available dimensions. When there are only two input characteristics, the hyperplane is essentially a line. The hyperplane turns into a 2-D plane if the number of input characteristics is three. When there are more than three features, it gets harder to imagine. The hyperplane that best portrays the greatest gap or margin between the two classes is one logical option. Therefore, the hyperplane that maximizes the distance from it to the closest data point on each side is selected. A maximum-margin hyperplane or hard margin is said to exist if one does.
We want to optimize the distance between the data points and the hyperplane in the SVM method. The loss function known as hinge loss aids in maximizing the margin. When the expected and actual values have the same sign, then determine the loss value if they are not.
\[c\left(\mathbf{x}, \mathbf{y}, f\left(\mathbf{x}\right)\right) = \begin{cases} 0, & f \left.\mathbf{y} \ast f\left(\mathbf{x}\right) \right| \ge 1\\ 1 - \mathbf{y} \ast f\left(\mathbf{x}\right), & \text{else} \end{cases}\]
The following are crucial variables in the SVM algorithm: C: Maintaining high values of C will tell the SVM model to select a narrower margin hyperplane. The SVM model will select a larger margin hyperplane if C is not a signi!cant value. To generate an SVM model, a kernel type must be employed. Linear, rbf, poly, or sigmoid are all possible. “rbf” is the kernel’s default value and degree. It is only taken into account while using the polynomial kernel. It is the kernel function’s degree for the polynomial. A degree’s default value is 3.
3.2.3 XGBoost Algorithm
The XGBoost decision tree-based ensemble machine learning approach makes use of the gradient boosting methodology. In many cases, arti!cial neural networks perform better than all other algorithms or frameworks when it comes to unstructured data prediction problems (pictures, text, etc.). To handle small to moderate volumes of structured/tabular data, decision tree-based algorithms are now regarded as bestin-class. The following are the main algorithmic enhancements of the XGBoost algorithm: Regularization combines both L1 and L2 regularization to penalize more complex models to prevent over!tting. Sparsity awareness, which more skillfully controls various types of sparsity patterns in the data, accepts sparse features for inputs by automatically “learning” the best missing value depending on training loss. Weighted quantile sketch easily determines the best split points between weighted datasets and cross-validation at each iteration by eliminating the need to manually construct this search and to denote the speci!c number of boosting iterations mandatory in a single run.
The combined prediction scores of each decision tree lead to the !nal prediction score of the classi!er. A key aspect of the example is that the two trees attempt to complement one another. We can formulate our model mathematically as follows:
\[\hat{\mathcal{Y}}\_i = \sum\_{k=1}^K f\_k\left(\mathbf{x}\_i\right), f\_k \in F\]
f is the functional space of F, K is the number of trees, and F is the set of potential CARTs. The following statements provide the model’s objective function:
\[\text{obj}\left(\boldsymbol{\theta}\right) = \sum\_{i}^{n} \left(\boldsymbol{\mathcal{V}}\_{i}, \hat{\boldsymbol{\mathcal{V}}}\_{i}\right) + \sum\_{k=1}^{K} \boldsymbol{\Omega}\left(\boldsymbol{f}\_{k}\right)^{k}\]
where the regularization parameter is the second term and the !rst term is the loss function. Now we apply the additive strategy, minimize the loss of what we have learned, and add a new tree, which can be summarized as follows:
\[\begin{split} \hat{\boldsymbol{\hat{\boldsymbol{\nu}}}}\_{i}^{(0)} &= \mathbf{0} \, \hat{\boldsymbol{\boldsymbol{\hat{\nu}}}}\_{i}^{(1)} = \boldsymbol{f}\_{1} \left( \mathbf{x}\_{i} \right) = \hat{\boldsymbol{\boldsymbol{\hat{\nu}}}}\_{i}^{(0)} + \boldsymbol{f}\_{1} \left( \mathbf{x}\_{i} \right) \hat{\boldsymbol{\boldsymbol{\hat{\nu}}}}\_{i}^{(2)} \\ &= \boldsymbol{f}\_{1} \left( \mathbf{x}\_{i} \right) + \boldsymbol{f}\_{2} \left( \mathbf{x}\_{i} \right) = \hat{\boldsymbol{\boldsymbol{\hat{\nu}}}}\_{i}^{(1)} + \boldsymbol{f}\_{2} \left( \mathbf{x}\_{i} \right) \hat{\boldsymbol{\boldsymbol{\hat{\nu}}}}\_{i}^{(1)} \\ &= \sum\_{k=1}^{l} \boldsymbol{f}\_{k} \left( \mathbf{x}\_{i} \right) = \hat{\boldsymbol{\boldsymbol{\hat{\nu}}}}\_{i}^{(l-1)} + \boldsymbol{f}\_{i} \left( \mathbf{x}\_{i} \right) \end{split}\]
The following is a de!nition of the model’s objective function:
\[\begin{split} \mathbf{obj}^{(t)} &= \sum\_{l=1}^{n} \mathbf{f}\left(\mathbf{y}\_{i}, \hat{\mathbf{y}}\_{i}^{(t)}\right) + \sum\_{l=1}^{l} \boldsymbol{\Omega}\left(\mathbf{f}\_{i}\right) = \sum\_{l=1}^{n} \mathbf{f}\left(\mathbf{y}\_{i}, \hat{\mathbf{y}}\_{i}^{(t-1)} + \mathbf{f}\_{i}\left(\mathbf{x}\_{i}\right)\right) + \boldsymbol{\Omega}\left(\mathbf{f}\_{i}\right) + \text{constant obj}^{(t)} \\ &= \sum\_{l=1}^{n} \left(\mathbf{y}\_{i} - \left(\hat{\mathbf{y}}\_{i}^{(t-1)} + f\_{i}\left(\mathbf{x}\_{i}\right)\right)\right)^{2} + \sum\_{l=1}^{l} \boldsymbol{\Omega}\left(f\_{i}\right) + \text{constant obj}^{(t)} = \\ &= \sum\_{l=1}^{n} \left[\mathbf{2}\left(\hat{\mathbf{y}}\_{i}^{(t-1)} - \mathbf{y}\_{i}\right) f\_{i}\left(\mathbf{x}\_{i}\right) + f\_{i}\left(\mathbf{x}\_{i}\right)^{2}\right] + \boldsymbol{\Omega}\left(f\_{i}\right) + \text{constant obj}^{(t)} \end{split}\]
3.2.4 Random Forest Method
As an alternative to depending solely on a single decision tree, a random forest considers the prediction from every tree and decides its prediction of the concluding output based on the majority votes of predictions. It comprises several decision trees on several subsets of the dataset and considers the average to increase the predictive accuracy of that dataset. Higher accuracy is obtained, and over!tting is avoided because of the more number of trees in the forest.
To produce the random forest, N decision trees are combined, and then, in the second step, predictions are made for every tree from the initial phase. The steps in the working process of random forest are choosing K data points at random from the training set, generating the decision trees connected to the taken data points, selecting the decision tree N that you wish to construct, Re-do 1 and 2 steps, and for any new data points, locate each decision tree’s predictions for the new data point and group the new data points into the category with the maximum support.
3.2.5 Deep Neural Network
The input data is processed by the nodes in the !rst layer, who then output it to the neurons in the second layer, and so on, producing the output (Refer to Fig. 3). The result could be a forecast like “Yes” or “No” which is represented in probability. Each neuron in a layer, whether it be one or many, will compute a little function called an activation function. The activation process imitates the signal that should be sent to the subsequently linked neurons. The output is passed or ignored depending on whether the value produced by the input neurons exceeds a threshold. An associated weight would be present for any connection between two neurons in successive
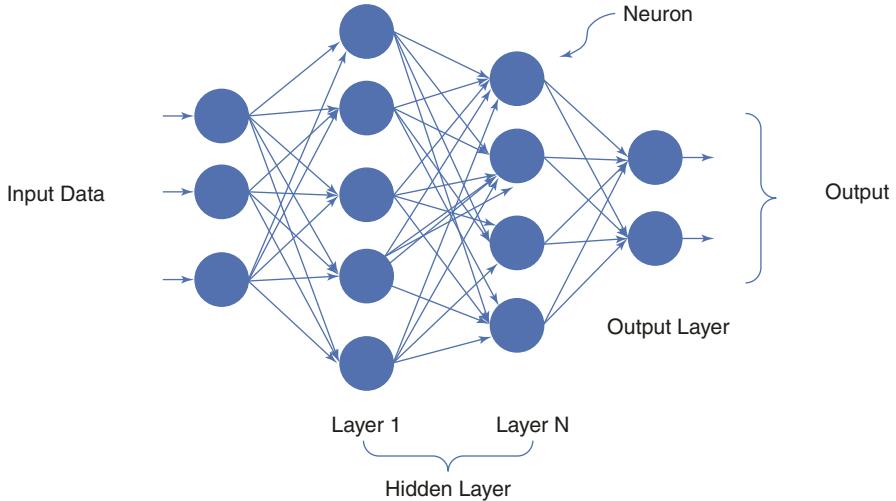
Fig. 3 The architecture of Deep Neural Network
levels. The weight identi!es how the input will affect the subsequent neuron’s output and, ultimately, the total result. The preliminary weights in a neural network would be completely random, however, the weights would be attuned iteratively during the model training to predict the accurate output. After breaking down the network into its parts, a few logical building blocks can be identi!ed, such as a neuron, layer, weight, input, output, activation function, and !nally a learning mechanism (optimizer), which will enable the network to gradually update its initialized weights (which were chosen at random) to weights that are better suited for accurate outcome prediction.
3.2.6 Long Short-Term Memory (LSTM) Network
LSTM is a special form of RNN that can recognize long-term dependencies. They are currently in extensive use and work amazingly well when applied to a variety of problems. LSTMs are designed speci!cally to avoid the long-term dependence problem. They don’t have a hard time picking up new material; in fact, it’s almost like it comes naturally to them to retain it for a long time. All recurrent neural networks take the form of a succession of repeating neural network modules. Typical RNNs will only have one Tanh layer in this recurring module, for example. LSTMs have a structure that resembles a chain, but the repeating module is built differently. There are four neural network layers instead of just one, and they interact in a very unique way. The memory cell and gates, which include the forget gate as well as the input gate, are the two most important parts of the LSTM. The input and forget gates regulate the inner contents of the memory cell. The contents of the memory cell would not change between the one-time step and the next gradients, assuming both segues are closed. Information may be retained over a large number of time steps thanks to gating structures, which also enable groups of information to “ow across a large number of time steps. This enables the LSTM model to effectively deal with the vanishing gradient
| Layer (type) | Output Shape | Param # |
|---|---|---|
| 1stm 35 (LSTM) | (None, 1, 256) | 1737728 |
| 1stm 36 (LSTM) | (None, 1, 256) | 525312 |
| 1stm 37 (LSTM) | (None, 1, 256) | 525312 |
| 1stm 38 (LSTM) | (None, 1, 256) | 525312 |
| 1stm 39 (LSTM) | (None, 128) | 197120 |
| dense 7 (Dense) | (None, 1) | 129 |
| Total params: 3,510,913 Trainable params: 3,510,913 |
Fig. 4 Summary of the LSTM model used in the implementation
issue that most recurrent neural network models experience. Figure 4 demonstrates the summary of the LSTM model used in the implementation.
3.3 Experimental Setup
With an average actigraph recording period of 12.7 days (SD = 2.8, range 5–18 days) and an average age of 42.8 years, the condition group of the experiment consists of 10 girls and 13 males. The mean MADRS score ranged from 22.7 (SD = 4.8) at the start of recordings to 20.0 (SD = 4.7) by the conclusion. Eight people were found to have bipolar disorder, while !fteen people had unipolar depression. The control group, with an average actigraph wear time of 12.6 days (SD = 3.3) and with a mean age of 38.2 (SD = 13), with involvement of 20 females and 12 males. Table 1 presents the characteristics of the experiment’s data. For ML algorithms to effectively capture the important information in the original dataset, statistical features must be extracted from raw data !les and reduced to a manageable amount of variables. The statistical features that were recovered for this experiment were the mean of the activity, the associated standard deviation (SD), and the fraction of minutes with the activity level as zero. Each participant’s pre-normalized features from each day were utilized to get the mean values.
It is believed that the dataset accurately represents clinical data from real-world situations despite its imbalance, which includes 291 depressed and 402 nondepressed instances. Because ML algorithms tend to work better for the class that is better represented, we investigated two different class balance solutions. Oversampling is one of the two techniques used, and under-sampling is the other. Oversampling, which generates new synthetic samples at random from relevant
| Condition group | Control group | |||
|---|---|---|---|---|
| Parameter | (Depressed patients) | (Healthy people) | ||
| No. of people | 23 | 32 | ||
| Gender | Male | 13 | 12 | |
| Female | 10 | 20 | ||
| Age | Mean | 42.8 | 38.2 | |
| SD | 11.0 | 13 | ||
| Total no of days tracked | 291 | 402 | ||
| Days in actigraph tracking | Mean | 12.7 | 12.6 | |
| SD | 2.8 | 2.3 | ||
| Label | Unipolar | 15 | – | |
| Bipolar | 8 | – | ||
| MADRS at start | Mean | 22.7 | – | |
| SD | 4.8 | – | ||
| MADRS at end | Mean | 20.0 | – | |
| SD | 4.7 | – | ||
| Mean activity | Mean | 190.05 | 286.59 | |
| SD | 81.44 | 81.10 | ||
| Proportion of zeros | Mean | 0.385 | 0.299 | |
| SD | 0.154 | 0.086 |
Table 1 Characteristics of the data considered for the experimentation
neighboring areas, uses the SMOTE technique. SMOTE mixes minority instances that currently exist to produce new minority instances. It applies linear interpolation to produce additional instances for the minority class. These synthetic training records are picked at random from the k-nearest neighbors for every instance in the minority class. The NearMiss strategy is one of several under-sampling techniques that aim to balance the class distribution by arbitrarily deleting instances of the majority class. If the instances of two distinct classes are reasonably similar to one another, remove the instances of the majority class to increase the separation between the two classes. Additionally, we evaluated the effectiveness of four different machine learning classi!ers: Logistic Regression, SVM, XGBoost, and Random Forest. Among the chosen techniques, XGBoost and random forest are ensemble methods, whereas logistic regression and SVM are conventional algorithms.
3.4 ML Model Hyperparameter Tuning
The hyperparameters to be tuned for the LR algorithm are four parameters for achieving the valid reasons which are the regularization parameter, regularization type, an algorithm to use in the optimization problem, and the maximum number of iterations taken for the solvers to converge. Regularization is an adjustment to a learning algorithm that aims to lower its generalization error without affecting the training error. As part of experimentation, in logistic regression, L2 regularization with a regularization parameter value of one is used. The parameter solver gives the
option to select the solver algorithm for optimization. The solver algorithm used in the experimentation is LBFGS which represents BFGS with restricted RAM. This solver is more computationally ef!cient because it just computes an approximate value of the Hessian based on the gradient. However, because it consumes less memory than a standard BFG, it discards older gradients and only accumulates newer gradients to the extent permitted by the memory restriction. The number of iterations taken by the solver for convergence is 100.
The performance of the SVM algorithm depends on only three hyperparameters which are the regularization parameter, Kernel type, and coef!cient. In the experimentation, the scale kernel coef!cient which is used to scale the input data to a feature before applying it to the kernel function is used. The linear kernel function is used to transform the data with a regularization parameter value of one.
XGBoost algorithm performance is subject to the parameters no.of trees, step size shrinkage used to prevent over!tting, loss function to be optimized, function to estimate the quality of a split, and Maximum limit for depth of each tree. The number of trees constructed in the experimentation is 75. To prevent the over!tting of the constructed trees, the learning rate is tuned as 0.01 with log_loss function as the loss function for optimization, friedman_mse is used for !nding the best split in the process of tree construction, and the max limit for depth of the tree is set as 3.
The hyperparameters to be adjusted for the RF algorithm are a count of trees in the forest, a metric used to estimate the quality of a split, the number of samples required at least to split an internal node, samples required at the place a leaf node, and features to be considered for the best split. 75 trees are constructed in the random forest algorithm. The number of samples plays a major role to expand a tree at any particular node. The minimum number of samples is taken as two in the experimentation, and to check the quality of splitting, Gini index measure is used. At most one sample is only required to place a leaf node by stopping the tree expansion process. The square root function is used for the total features to decide the max limit for the features to be considered at every node of the tree while selecting the best feature for splitting.
A recti!ed linear unit (ReLU) served as the activation function for the 10 completely connected hidden layers that made up the DNN architecture. Dropout is used with p as 0.5 after each layer, and the !nal layer has two units with a softmax activation function. Adam solver is used to optimize the weights with a batch size of 32 and a learning rate of 0.001. The hyperparameters of LSTM are loss, optimizer, epochs, learning rate, and batch size. The batch size is taken as 128 with a learning rate of 0.001. The binary cross-entropy loss function is used for error calculation, and the Adam optimizer is used for optimizing the weights. LSTM is implemented with 50 epochs.
3.5 Evaluation Metrics
Since the objective of the machine learning algorithms is to categorize instances as depressed mood cases or controls, the results were provided in measures of accuracy. Accuracy is the percentage of cases in the dataset with the right classi!cation. Speci!city is the proportion of controls properly classi!ed as controls, whereas sensitivity is the percentage of appropriately classi!ed conditions among all conditions. The harmonic mean of sensitivity and speci!city is known as the F1-score. The weighted recall is a calculation that equalizes sensitivity and speci!city based on sample sizes. The Predicted Positive Rate (PPR) and Predicted Negative Rate (PNR) show how many conditions (positive) or controls have been correctly classi- !ed in comparison to how many have been incorrectly classi!ed (negative). An estimation known as weighted precision combines the predicted values based on sample sizes. Since accuracy does not take the dataset’s imbalance into account when presenting results, it may offer results that are not accurate. When datasets are unbalanced, the Matthews Correlation Coef!cient (MCC) is used to assess the classi!ers’ overall performance. In MCC, the coef!cient value ranges from minus one to one, with zero denoting a random approximation.
| If we consider TD: True depressed (depressed cases labeled correctly as depressive) |
|---|
| FC: False control (depressed cases labeled as healthy cases) |
| TC: True control (healthy cases labeled correctly as healthy |
| FD: False depressed (healthy cases mislabeled as depressed cases), the performance metrics are |
| de!ned as |
| Accuracy: (TD + TC) / (TD + TC + FD + FC) |
| Sensitivity: TD / (TD + FC) |
| Speci!city: TC / (TC + FD) |
| F1-score: (2Weighted_PrecisionWeighted_Recall)/(Weighted_Precision + Weighted_Recall) |
| Weighted recall: (sensitivity x (TD + FC)) + (speci!city x (TC + FD)) / (TD + FC + TC + FD) |
| Weighted precision: (PPV x (TD + FC)) + (NPV x (TC + FD)) / (TD + FC + TC + FD) |
| PNR: TC / (TC + FC) |
| PPR: TD / (TD + FD) |
4 Results and Discussion
The demonstrations in Table 2 are the results of the ML algorithms experimentation. For every algorithm, three runs were done. Baseline is the algorithm implementation with the original dataset, SMOTE is the algorithm implementation with oversampling techniques to balance the dataset, and NearMiss is the algorithm implementation with the under-sampling technique for getting the balanced dataset.
As part of the conventional techniques of machine learning, SVM gives good results for identifying the depressed condition, SVM got 89.93% accuracy, 90.56% sensitivity, 88.64% speci!city, and 92.32% F1-Score. SVM implementation with SMOTE oversampling technique gives better for all the parameters except weighted precision and PPR. SVM with NearMiss under the sampling technique achieves 96.85% and 93.79% for weighted precision and PPR, respectively. SVM attains good results compared to logistic regression for Matthews Correlation Coef!cient also which are 77.82%, 85.64%, and 82.03% for original, SMOTE, and NearMiss implementations, respectively.
The best performance algorithm as part of ensemble machine learning algorithms experimentation is RF with an accuracy of 94.17% on the original dataset, 95.99% with SMOTE oversampling technique, and 93.57% with the NearMiss under-sampling technique. The parameter sensitivity is highest for the XGBoost algorithm which is 92.84%, 95.44%, and 94.43% for original, SMOTE, and NearMiss implementations, respectively. Speci!city is highest for random forest algorithm with 97.67%, 97.49%, and 91.6% for original, SMOTE, and NearMiss implementations, respectively. F1-score and predicted negative rate are high for the XGBoost algorithm while the remaining measures are high for the RF algorithm. In the case of Matthews Correlation Coef!cient, XGBoost performance is high with 86.48%, 92.55%, and 87.83% correlation coef!cient values for the original dataset, SMOTE, and NearMiss techniques, respectively.
Among the deep learning models implemented, DNN got 94.66%, 96.74%, and 94.26% of accuracy for baseline, SMOTE, and NearMiss implementations, respectively. The weighted precision is calculated as 99.46%, 88.44%, and 99.13% for
| Classi!cation results | ||||||||||
|---|---|---|---|---|---|---|---|---|---|---|
| ML | Class | W_ | W_ | |||||||
| model | balancing | Acc | Sen | Spe | F1-score | recall | precision | PNR | PPR | MCC |
| LR | Baseline | 0.885 | 0.897 | 0.862 | 0.918 | 0.885 | 0.953 | 0.809 | 0.928 | 0.748 |
| SMOTE | 0.926 | 0.938 | 0.914 | 0.942 | 0.926 | 0.958 | 0.940 | 0.912 | 0.853 | |
| NearMiss | 0.881 | 0.870 | 0.894 | 0.914 | 0.881 | 0.949 | 0.863 | 0.900 | 0.763 | |
| SVM | Baseline | 0.899 | 0.905 | 0.886 | 0.929 | 0.899 | 0.961 | 0.823 | 0.941 | 0.778 |
| SMOTE | 0.928 | 0.922 | 0.933 | 0.947 | 0.928 | 0.967 | 0.921 | 0.934 | 0.856 | |
| NearMiss | 0.909 | 0.888 | 0.933 | 0.938 | 0.909 | 0.968 | 0.880 | 0.937 | 0.820 | |
| XGBoost | Baseline | 0.938 | 0.928 | 0.958 | 0.961 | 0.938 | 0.987 | 0.863 | 0.979 | 0.864 |
| SMOTE | 0.962 | 0.954 | 0.971 | 0.974 | 0.962 | 0.986 | 0.953 | 0.972 | 0.925 | |
| NearMiss | 0.939 | 0.944 | 0.934 | 0.953 | 0.939 | 0.968 | 0.943 | 0.934 | 0.878 | |
| RF | Baseline | 0.941 | 0.925 | 0.976 | 0.966 | 0.941 | 0.993 | 0.857 | 0.988 | 0.873 |
| SMOTE | 0.959 | 0.945 | 0.974 | 0.973 | 0.959 | 0.988 | 0.943 | 0.975 | 0.920 | |
| NearMiss | 0.935 | 0.956 | 0.916 | 0.947 | 0.935 | 0.960 | 0.957 | 0.913 | 0.872 | |
| DNN | Baseline | 0.946 | 0.930 | 0.980 | 0.970 | 0.946 | 0.990 | 0.867 | 0.994 | 0.884 |
| SMOTE | 0.967 | 0.954 | 0.980 | 0.979 | 0.967 | 0.981 | 0.953 | 0.991 | 0.935 | |
| NearMiss | 0.942 | 0.963 | 0.922 | 0.952 | 0.942 | 0.920 | 0.964 | 0.963 | 0.886 | |
| LSTM | Baseline | 0.953 | 0.937 | 0.988 | 0.975 | 0.953 | 0.994 | 0.881 | 0.997 | 0.900 |
| SMOTE | 0.975 | 0.963 | 0.988 | 0.985 | 0.975 | 0.988 | 0.962 | 0.995 | 0.951 | |
| NearMiss | 0.956 | 0.981 | 0.933 | 0.962 | 0.956 | 0.931 | 0.982 | 0.968 | 0.914 |
Table 2 Experimental results of ML algorithms
baseline, SMOTE, and NearMiss implementations, respectively. The Matthews Correlation Coef!cient is calculated as 93.51% for baseline, 96.35% for SMOTE, and 88.62% for NearMiss sampling techniques. LSTM got 95.39%, 97.57%, and 95.65% accuracy, respectively, for baseline, SMOTE, and NearMiss implementations. PPR is attained highest in the calculated parameters which are 99.43%, 98.88%, and 93.10%, respectively, for the three implementations. The speci!city is exhibited as 98.85%, 98.85%, and 93.33%, respectively, and Matthews Correlation Coef!cient is exhibited as 90.04%, 95.18%, and 91.43%, respectively, for the three experiments of baseline, SMOTE, and NearMiss techniques.
Some employ more subtle techniques, such as the one presented by Amanant et al. [48], who suggested using LSTM to forecast depression from language, semantics, and textual data. 99.0% accuracy is attained by the suggested framework. While Kour [49] projected an integrated model for depression detection utilizing CNN and biLSTM and achieved a 99.28% accuracy on standard tweets including depressive symptoms. According to the !ndings, there is a signi!cant difference in the language representation of depressive and non-depressive data. Nearly everyone uses portable gadgets daily these days. Undoubtedly, the bodily motions we perform during the day are one trait that distinguishes humans. It is possible to think of this as motor activity, which is not more than recurrent social rhythms interacting with biological tempos and being controlled by the 24-h circadian clock interlaced with countless 2–6 h cycles [22]. Signi!cant signs of mood disruption may be present if these biological rhythmic rhythms are out of balance [50]. Actigraphs, which typically record gravity acceleration units using a bracelet, are noninvasive devices that can track human activity and rest cycles. The actigraph is the tool that has been employed for the data gathering of motor activity.
In a review of studies employing EEG data to identify the two types of depression, major depressive disorder (MDD) and bipolar disorder (BD), Yasin et al. [51] used neural network and deep learning algorithms. It searched for publications that have been published over the past 10 years using a variety of source engines and a blend of different keywords, then retrieved some helpful information from those. This review’s inclusion of many categories for exploited datasets, techniques for extracting features, and algorithms in publications was one of its strong qualities. The main issue in this research, especially for MMD diagnosis, was that there weren’t enough articles to review; as a result, it only used about !ve, as claimed. Additionally, the articles that were used to support them did not adequately explain how to understand the gist of their operation.
The reviewed studies by [52] were focused on used deep learning techniques to investigate mental disorders, with depression as one of the topics, to better understand them. The four primary categories of this study were using social media data to predict the likelihood of psychological illness, using clinical data to detect mental illness, using genetic data to diagnose disease, and assessing other datasets. The electroencephalogram dataset type was only used in three papers that were speci! cally concerned with the identi!cation or prognosis of depression among the selected papers that were published up through April 2019 that made use of various types of datasets. In this study, all of the analyzed datasets were fully represented. Additionally, it went into great detail on the potential and dif!culties that using each dataset is likely to present. However, because it was a thorough review that focused on embracing a variety of mental disease situations, it brie”y discussed a few studies on utilizing deep learning for EEG signal analysis to diagnose and forecast depression.
Khosla et al. [53] conducted a study of studies that were centered on EEG signals and other models to diagnose neurological conditions, like depression, and monitor other issues of emotion recognition. Only four papers were from an earlier period, and the majority of the papers were published between 1999 and 2019. They were obtained from a variety of sources, including journals, conferences, books, and theses. Only a few ten publications were taken into consideration in terms of the diagnosis of depression. It also included knowledge of functional neuroimaging methods. But because it covered a wide range of topics, it was unable to give each topic the attention it deserved.
5 Conclusion
The work in this article is an analysis of motor activity data for unipolar and bipolar depression classi!cation using motor activity recordings of 23 unipolar & bipolar depression patients with 32 controls. The classi!cation is performed using traditional machine learning, ensemble machine learning, and deep learning algorithms as well. Compared to the traditional machine learning algorithms, ensemble learning algorithms XGBoost and random forest are ef!cient in classifying depression disorders with actigraph data. In deep learning, LSTM and DNN are used for detecting depressive disorder. LSTM achieves good results compared to the deep neural network as it is having memory storage which is the main component while analyzing the time series data. The used machine learning and deep learning algorithms in this article are not considering non-depressive causes of reduced activity, such as injury, illness, old age, etc. These parameters also play a major role in the reduction of the activity data. Social media analysis also has been successfully investigated separately to predict depression in users based on their conversations and sharing of posts, in the future more technologically sophisticated models based on motor activity counts mixed with the subject’s physical illness and social media postings can be created to accurately predict depression.
Con”icts of Interest No author has any con”icts of interest
References
- Fisher J, de Mello MC, Patel V, Rahman A, Tran T, Holton S, Holmes W. Prevalence and determinants of common perinatal mental disorders in women in low-and lower-middle-income countries: a systematic review. Bull World Health Organ. 2012;90:139–49.
- Navarro-Loli JS, Moscoso M. La investigación de la depresiónenadolescentesen el Perú: unarevisiónsistemática. Liberabit. 2017;23(1):57–74.
- Cooper J, Nusslock R, Craske M, Zinbarg R, Chat IKY, Barch D, Reddy F, Green M, Horan W, Treadway M. 47. Computational models of effort-based choice in patients with major depression and schizophrenia. Biol Psychiatry. 2018;83:S19.
- Foo JC, Redler S, Forstner AJ, Basmanav FB, Pethukova L, Guo J, Streit F, et al. Exploring the overlap between alopecia Areata and major depressive disorder: epidemiological and genetic perspectives. J Eur Acad Dermatol Venereol. 2023;37:1547.
- Mehta S, GerasimosKonstantinou CR, Weissman ZJ, Daskalakis DV, Downar J, Mulsant BH, Blumberger DM. The effect of repetitive transcranial magnetic stimulation on suicidal ideation in treatment-resistant depression: a meta-analysis. J Clin Psychiatry. 2022;83(2):39202.
- Sedano-Capdevila A, Porras-Segovia A, Bello HJ, Baca-Garcia E, Barrigon ML. Use of ecological momentary assessment to study suicidal thoughts and behavior: a systematic review. Curr Psychiatry Rep. 2021;23(7):41.
- Seppälä J, De Vita I, TimoJämsä JM, MattiIsohanni KR, Feldman Y, et al. Mobile phone and wearable sensor-based mHealth approaches for psychiatric disorders and symptoms: systematic review. JMIR mental health. 2019;6(2):e9819.
- Firth J, Torous J, Nicholas J, Carney R, Rosenbaum S, Sarris J. Can smartphone mental health interventions reduce symptoms of anxiety? A meta-analysis of randomized controlled trials. J Affect Disord. 2017;218:15–22.
- Huckvale K, Nicholas J, Torous J, Larsen ME. Smartphone apps for the treatment of mental health conditions: status and considerations. Curr Opin Psychol. 2020;36:65–70.
- Bayındır L. A survey of people-centric sensing studies utilizing mobile phone sensors. J Ambient Intell Smart Environ. 2017;9:421–48.
- Nilsson MY, Andersson S, Magnusson L, Hanson E. Ambient assisted living technologymediated interventions for older people and their informal carers in the context of healthy ageing: a scoping review. Health science reports. 2021;4(1):e225.
- Berle JO, Hauge ER, Oedegaard KJ, Holsten F, Fasmer OB. Actigraphic registration of motor activity reveals a more structured behavioural pattern in schizophrenia than in major depression. BMC Res Notes. 2010;3:149.
- Huguet A, Rao S, McGrath PJ, Wozney L, Wheaton M, Conrod J, Rozario S. A systematic review of cognitive behavioral therapy and behavioral activation apps for depression. PLoS One. 2016;11:e0154248.
- Mohr DC, Zhang M, Schueller SM. Personal sensing: understanding mental health using ubiquitous sensors and machine learning. Annu Rev Clin Psychol. 2017;13:23–47.
- Guntuku SC, Yaden DB, Kern ML, Ungar LH, Eichstaedt JC. Detecting depression and mental illness on social media: an integrative review. Curr OpinBehav Sci. 2017;18:43–9.
- Kolosnjaji B, Eckert C. Neural network-based user-independent physical activity recognition for mobile devices. International Conference on Intelligent Data Engineering and Automated Learning. Springer; 2015.
- Inoue M, Inoue S, Nishida T. Deep recurrent neural network for mobile human activity recognition with high throughput. Arti!cial Life and Robotics. 2018;23(2):173–85.
- Bzdok D, Ioannidis JPA. Exploration, inference, and prediction in neuroscience and biomedicine. Trends Neurosci. 2019;42:251.
- Huys QJM, Maia TV, Frank MJ. Computational psychiatry as a bridge from neuroscience to clinical applications. Nat Neurosci. 2016;19(3):404–13.
- Sabelli HC, Carlson-Sabelli L, Javaid JI. The thermodynamics of bipolarity: a bifurcation model of bipolar illness and bipolar character and its psychotherapeutic applications. Psychiatry. 1990;53(4):346–68.
- Adhikari SP. Factor analysis study of phenomenological subtypes of mania. Ann Psychiatr Clin Neurosci. 2019;2(1):1009.
- Bourguignon C, Storch K-F. Control of Rest: Activity by a Dopaminergic Ultradian Oscillator and the Circadian Clock. Front Neurol. 2017;8:614.
- Pathak J, Wikner A, Fussell R, Chandra S, Hunt BR, Girvan M, et al. Hybrid forecasting of chaotic processes: Using machine learning in conjunction with a knowledge-based model. Chaos: An Interdisciplinary. J Nonlinear Sci. 2018;28(4):041101.
- Smys S, Raj JS. Analysis of deep learning techniques for early detection of depression on social media network—a comparative study. J Trends Comput Sci Smart Technol (TCSST). 2021;3:24–39.
- Orabi AH, Buddhitha P, Orabi MH, Inkpen D. Deep learning for depression detection of twitter users. In: Proceedings of the Fifth Workshop on Computational Linguistics and Clinical Psychology: From Keyboard to Clinic, vol. 5. New Orleans, LA; 2018. p. 88–97.
- Kim J, Lee D, Park E. Machine learning for mental health in social media: bibliometric study. J Med Internet Res. 2021;23:e24870.
- Wongkoblap A, Vadillo M, Curcin V. Depression detection of twitter posters using deep learning with anaphora resolution: algorithm development and validation. JMIR Ment Health. 2021; https://kclpure.kcl.ac.uk/portal/en/publications/depression-detection-of-twitter-posters-usingdeep-learning-with-anaphora-resolution-algorithm-development-and-validation(1b1ef794- 5c96-4890-a0a2-04bf74323540).html
- Un Nisa Q, Muhammad R. Towards transfer learning using BERT for early detection of selfharm of social media users. In: Proceedings of the Working Notes of CLEF 2021—Conference and Labs of the Evaluation Forum. Bucharest, Romania; 2021. p. 21–4.
- Chiong R, Budhi GS, Dhakal S. Combining sentiment lexicons and content-based features for depression detection. IEEE Intell Syst. 2021;36:99–105.
- Fujita, H.; Selamat, A.; Lin, J.C.W.; Ali, M. Advances and trends in arti!cial intelligence: from theory to practice: 34th international conference on industrial, engineering and other applications of applied intelligent systems, IEA/AIE 2021, Kuala Lumpur, Malaysia, 26–29, 2021.: Proceedings, Part II.
- Ibitoye AO, Famutimi RF, Olanloye DO, Akioyamen E. User centric social opinion and clinical Behavioural model for depression detection. Int J Intell Inf Syst. 2021;10:69.
- Trifan A, Antunes R, Matos S, Oliveira JL. Understanding depression from psycholinguistic patterns in social media texts. Adv Inf Retr. 2020;12036:402–9.
- Mathur P, Sawhney R, Chopra S, Leekha M, Shah RR. Utilizing temporal psycholinguistic cues for suicidal intent estimation. Adv Inf Retr. 2020;12036:265–71.
- Lin L, Chen X, Shen Y, Zhang L. Towards automatic depression detection: a BiLSTM/1d CNN-based model. Appl Sci. 2020;10(23):1–20. https://doi.org/10.3390/app10238701.
- Wang Z, Chen L, Wang L, Diao G. Recognition of audio depression based on convolutional neural network and generative antagonism network model. IEEE Access. 2020;8:101181–91. https://doi.org/10.1109/ACCESS.2020.2998532.
- Ma X, Yang H, Chen Q, Huang D, Wang Y. DepAudioNet: an ef!cient deep model for audio based depression classi!cation. In: AVEC 2016 - Proc. 6th Int. Work. Audio/Visual Emot. Challenge. ACM Multimed; 2016. p. 35–42. https://doi.org/10.1145/2988257.2988267.
- Le H-N, Boyd RC. Prevention of major depression: early detection and early intervention in the general. Population. 2022;2006:23.
- Alghamdi NS, Hosni Mahmoud HA, Abraham A, Alanazi SA, García-Hern’andez L. Predicting depression symptoms in an Arabic psychological forum. IEEE Access. 2020;8:57317–34. https://doi.org/10.1109/ACCESS.2020.2981834.
- Babu NV, Kanaga EGM. Sentiment analysis in social media data for depression detection using arti!cial intelligence: a review. SN Comput Sci. 2022;3(1):1–20. https://doi.org/10.1007/ s42979-021-00958-1.
- Alhanai T, Ghassemi M, Glass J. Detecting depression with audio/text sequence modeling of interviews. In: Proc. Annu. Conf. Int. Speech Commun.Assoc. INTERSPEECH; 2018. p. 1716–20. https://doi.org/10.21437/Interspeech.2018-2522.
- Yang L, Pei E, Jiang D, Oveneke MC, Xia X, Sahli H. Multimodal measurement of depression using deep learning models. In: AVEC 2017—proc. 7th Annu. Work.Audio/visual Emot.
Challenge. 2017. pp. 53–54. https://doi.org/10.1145/3133944.3133948. Co-located with MM 2017, no. January 2018.
- Lam G, Dongyan H, Lin W, City S. Context-aware deep learning for multi-modal depression detection. In: ICASSP 2019-2019 IEEE international conference on acoustics, speech and signal processing (ICASSP). IEEE; 2019. p. 3946–50.
- Yang L, Jiang D, Sahli H. Integrating deep and shallow models for multi-modal depression analysis-hybrid architectures. IEEE Trans Affect Comput. 2021;12(1):239–53. https://doi. org/10.1109/TAFFC.2018.2870398.
- Yang L, Jiang D, He L, Pei E, Oveneke MC, Sahli H. Decision tree based depression classi!cation from audio video and language information. In: AVEC 2016 - Proc. 6th Int. Work. Audio/Visual Emot.Challenge. ACM Multimed; 2016. p. 89–96. https://doi. org/10.1145/2988257.2988269.
- Yokoya S, Maeno T, Sakamoto N, Goto R, Maeno T. A brief survey of public knowledge and stigma towards depression. J Clin Med Res. 2018;10(3):202–9. https://doi.org/10.14740/ jocmr3282w.
- Garcia-Ceja E, Riegler M, PetterJakobsen JT, Nordgreen T, Oedegaard KJ, BerntFasmer O. Depresjon: a motor activity database of depression episodes in unipolar and bipolar patients. In: Proceedings of the 9th ACM multimedia systems conference; 2018. p. 472–7.
- Montgomery SA, Asberg MARIE. A new depression scale designed to be sensitive to change. Br J Psychiatry. 1979;134(4):382–9.
- Amanat A, Rizwan M, Javed AR, Abdelhaq M, Alsaqour R, Pandya S, Uddin M. Deep learning for depression Detection from textual data. Electronics. 2022;11:676.
- Kour H, Gupta MK. An hybrid deep learning approach for depression prediction from user tweets using feature-rich CNN and bi-directional LSTM. Multimed Tools Appl. 2022;81:23649–23685.
- Alloy LB, Ng TH, Titone MK, Boland EM. Circadian rhythm dysregulation in bipolar Spectrum disorders. Curr Psychiatry Rep. 2017;19:1–10.
- Yasin S, Hussain SA, Aslan S, Raza I, Muzammel M, Othmani A. EEG based major depressive disorder and bipolar disorder detection using neural networks: a review. Comput Methods Prog Biomed. 2021;106007:106007. https://doi.org/10.1016/j.cmpb.2021.106007.
- Su C, Xu Z, Pathak J, Wang F. Deep learning in mental health outcome research: a scoping review. Transl Psychiatry. 2020;10(1):1–26.https://doi.org/10.1038/s41398-020-0780-3.
- Khosla A, Khandnor P, Chand T. A comparative analysis of signal processing and classi! cation methods for different applications based on EEG signals.Biocybernet. Biomed Eng. 2020;40(2):649–90.
Intelligent Monitoring System Based on ATmega Microcontrollers in Healthcare with Stress Reduce Effect

Z. Abdiakhmetova, Zh. Temirbekova, and G. Turken
Abstract Ensuring the well-being of individuals is a crucial responsibility in today’s society. The Medical Internet of Things (MIoT) plays a signi!cant role in the !eld of medicine and healthcare. This research aimed to create a patient monitoring system using sensors and Arduino boards, combining both hardware and software components. The system utilized three primary sensors to collect and promptly transmit the patient’s health data to a central server via the network. Whenever any abnormal data was detected, the system promptly noti!ed the doctor with an alarm message. To check the convenience and importance of the developed system for patients, tests have currently been carried out on 150 patients. Patient data was collected in the form of a dataset with various characteristics, such as age, gender, place of residence (region), hemoglobin concentration, red blood cell count, and other data obtained during the last visit to the doctor, as well as data received daily from Arduino sensors. The effectiveness of this system was evaluated, 85% of the patients surveyed were satis!ed with such a system, 7% of the test subjects were not completely satis!ed, and the rest ignored the survey. The adequacy and accuracy of predicting CVD were also assessed. The convenience and simplicity of the developed system have won the hearts of patients. Respondents believe that the system is less stress resistant and more reliable. Using data in the intelligence part of the system can predict the development of cardiovascular disease and fully illustrate the progress of the disease, but more detailed research is still needed.
Keywords Intelligent system · Stress reduce · ATmega · Microcontrollers · Monitoring
Z. Abdiakhmetova (*) · Zh. Temirbekova · G. Turken
Faculty of Information Technology, al-Farabi Kazakh National University, Almaty, Kazakhstan
G. Battineni et al. (eds.), Computational Methods in Psychiatry, https://doi.org/10.1007/978-981-99-6637-0\_3
1 Introduction
Currently, in our country, there is a negative trend in the state of health of the population. The growth of life expectancy has almost negative trends, the birth rate does not justify the expected forecasts of scientists, and high mortality rates do not change from year to year. Recently, it is important to note the increase in the incidence of the population both as a result of quarantine and as a lack of a healthy lifestyle, not to mention medical examinations and monitoring the health of patients. This and other factors such as smoking, air pollution, and untimely access to doctors, are threatening factors for human health, that is, the entire future of the country and even the whole nation remain at risk.
Health issues are the foundation of global development. Healthy communities make society more stable and the economy more prosperous, but for healthy communities to be fully functional, we must ensure that everyone has the ability to afford and have fair access to high-quality health services with the help of advanced technologies, the issue of monitoring the condition of patients, which is the main one in the world health program, will always be relevant. For this reason, the improvement of patient monitoring devices is a very important topic in both healthcare and information technology [1–3].
The concept of the Medical and Health Internet of Things emerged during a time of escalating global medical expenses, leading to its swift adoption within the medical and health industry. In 2017, the world’s healthcare expenditure reached approximately US $77.8 trillion, making up around 10% of the global GDP for that year. Between 2000 and 2017, the average growth rate of global medical and health expenses was 3.9%, surpassing the 3% average growth rate of the global GDP during the same period. In 2015, a study conducted by Goldman Sachs revealed that the Internet of Things for Medical and Health had the potential to signi!cantly boost revenue and lower costs, with the potential to save the United States over 300 billion U.S. dollars annually in medical expenses. However, achieving this bene!t depends on effectively transforming the vast data generated by millions of medical and health IoT devices into practical insights [4–6].
As computing power continues to advance and wireless technology becomes more compact, the Internet of Things (IoT) has evolved from a mere concept to a tangible reality, opening up diverse application scenarios. The development of innovative IoT medical equipment has greatly emphasized the crucial role of IoT technology in the medical and health industry. The increased connectivity of IoT has allowed for its implementation across various medical device categories, resulting in a substantial rise in the number of medical devices incorporating IoT capabilities. Consequently, this surge in IoT medical devices has driven advancements in sensors, IoT networks, service systems, and software to facilitate the collection and transmission of medicalgrade data. As a result, a seamless integration between IoT medical devices and medical and health IT systems has been established through the Internet of Things, enabling continuous and automated transmission of medical data. This amalgamation of IoT and healthcare IT systems is known as the MIoT or smart medical care.
The IoT in the medical and health sector refers to the incorporation of various IoT-related technologies like sensors, short-range communications, the Internet, cloud computing, big data, arti!cial intelligence [7, 8], etc., with medical and health technologies. The goal is to create a comprehensive network that to connects doctors, health managers, residents, patients, medical devices, medicines, the environment, and other factors to facilitate automatic identi!cation, positioning, data collection, tracking, management, and sharing of medical information. This integration aims to enhance the medical and health industry by providing comprehensive information, improving service ef!ciency, and enabling intelligent medical and health services centered around patients. Advancements in technology have led to the concept of gathering a patient’s vital sign without requiring them to physically visit a hospital [9]. Health care monitoring systems play a crucial role in monitoring a patient’s health parameters. Researchers developing health monitoring systems using different hardware platforms achieve the integration of various biomedical sensors, such as temperature and heart rate sensors, into a single system on a chip [10, 11]. This system continuously monitors the patient’s heart rate and temperature readings.
The proposed study involves an intelligent system comprising multiple devices controlled by a microcontroller to monitor the patient’s condition through various sensors, such as heart rate, blood pressure, and temperature sensors. This system ensures accurate signal readings, high ef!ciency, and faster processing. The collected signals are sent to the doctor via SMS to assess the patient’s emergency status. The system, utilizing ATmega 16, has been successfully tested, con!rming that each sensor effectively displays the patient’s emergency situation, facilitating appropriate treatment.
Previously, numerous authors explored this concept using various methods [12]. Our developed system introduces a novel approach to healthcare monitoring by employing a volume oscillometric method and sensor network for continuous blood pressure and temperature measurement. The data is displayed on two seven-segment modules, offering better visibility. Additionally, the system allows setting upper and lower limits for temperature and heart rate. If the temperature exceeds the upper limit or falls below the lower limit, the buzzer sounds, and the load is turned off. Similarly, if the heartbeat sensor is disconnected, and the system detects a low heartbeat, the buzzer activates, and the load is switched off. This buzzer serves as an emergency signal for the patient’s well-wishers. When the temperature and heart rate are within control, the bulb turns on, and the alarm deactivates.
In recent years, the healthcare industry has rapidly developed in terms of IoT technology. IoT can be utilized to track patient care and requirements effectively. Although IoT has various applications in healthcare, maintaining a high level of security is crucial. Applications include remote monitoring, integration of smart sensors and medical devices, activity trackers, wearable biometric sensors, blood glucose monitors, prescription dispensers, and smart beds. The Internet of IoMT is used to enhance patient diagnosis and treatment, with medical equipment companies developing connected devices for improved patient outcomes. IoT implementation can boost patient satisfaction and engagement by streamlining work”ows, providing clarity for patient releases, and facilitating better communication between patients and doctors, as vital information can be easily transmitted through connected devices.
Support the use of connected devices to remotely monitor chronic disease patients with persistent diseases can bene!t from remote examinations, mainly by using appropriate wearable clinical equipment. Patients who experience relapses of cardiovascular diseases can be provided with devices with the ability to inform the attending physician about the occurrence of the disease. Such devices will make it possible to plan places in hospitals in advance and treat patients using online recommendations. Such systems are able to monitor the work of medical personnel online, as well as the condition of patients. Improved versions of such systems can reduce costs and thus affect the economy of the whole country.
It is important to consider prevention as one of the main and major areas, since based on it, you can control the next stages of treatment and detection of diseases. The medical history of each patient in a digital and correct format can be used to generate a correct lifestyle regimen and predict diseases. The use of Internet of Things technologies can contribute to the improvement of methods and methods of treatment. In the insurance industry, there is a problem for physicians in providing companies with documentation of measures taken to improve the health of patients.
Online monitoring of the condition of patients can really support to reduce the material costs that were intended for inpatient monitoring. The widespread introduction of monitoring devices can not only reduce costs, but also respond in time to a patient’s problem. According to the World Health Organization, heart disease is the leading cause of death in patients around the world [13]. Diseases of the cardiovascular and circulatory system are also common causes of death in our country: it is 24.2% of cases, or in numbers it is 18.6 thousand people. Among them, about 7 thousand people died from coronary heart disease, more than 6 thousand people from cerebrovascular disease, and more than 530 people from arterial hypertension. Acute myocardial infarction and angina pectoris are also considered common causes of premature death. Such unsatisfactory statistics are re”ected not only in the healthcare sector of the country, but also in the economic and sociological development of the country [14, 15].
In Russia in 2008–2009, cardiovascular diseases caused a signi!cant scaleeconomic loss of 1 trillion rubles, which in those years was 3 percent of Russia’s gross domestic product. Such a loss to the national economy justi!es such large investments in prevention programs and research programs aimed at reducing cardiovascular diseases, which will inevitably lead to a decrease in early disability and mortality. Therefore, one of the important tasks of health care is the prevention of the disease, the prevention of its causes, early preclinical diagnosis, control, prevention, and offering a detailed treatment of this disease.
2 Research Background
Two sensors were used in the [16] study: one was a temperature sensor (LM35) and the other was a heart rate sensor (AD 8232). A study was conducted by connecting both sensors to an Arduino. The received data is used as input data to the Arduino
device. In case of values exceed the threshold, a noti!cation is sent to the patient’s relatives, and this information is stored in the cloud. Summarizing the results of the research, the authors concluded that the advantage of this prototype is that if the patient forgets to tell the doctor or misrepresents certain information, the doctor can access the correct information at any time, from any location. But according to the authors, this is still a very simple prototype. It has yet to be converted into a nanoscale product that integrates all sensors into a single chip core.
Researchers of [10] article used a data monitoring system with !ve components for monitoring: Arduino MEGA, Wi-Fi module ESP8266–01, !ngerprint sensor, ECG sensor, respiration sensor. According to the authors, the advantage of this system is that the user can access the !ngerprint sensor only with his !ngerprint to enter the application for viewing data, which means that the security aspect is also considered. The proposed by [1] microcontroller-based system used the option of administering a predetermined dose of anesthesia to the patient at equal time intervals. The anesthesia dose must be known in advance because the preset value is programmed as an input value. Components used in software development: Arduino Uno is used for full control, LM35 is for measuring degree of heating, cordial rate sensor, infusion pump with a stepper motor for controlling the movement of the syringe, L293D is needed to drive a DC motor, and LSD display (LM016L) parameters required to display status.
This system does not need the physical presence of a doctor, but nevertheless is not inferior in determining and evaluating the exact diagnosis of the patient. The author [2] believes that the system still needs improvement in solving complex problems. For example, for eight different inputs, several tests were run to monitor the speed of the system during processing. The conducted research shows that the accuracy shown by the Arduino system is comparatively much higher than other systems. Also in reliability when monitoring the length and delay of transmitted signals, Arduino shows good results.
The biggest advantage of using Arduino technology is the availability of open source. It is important to note the fact that Arduino is very accessible and there is a lot of supporting material on the Internet for working with this device. The authors refer to the fact that high speed and expensive analog devices cannot boast of other super features over Arduino. Perhaps these super devices can work milliseconds faster and more accurately.
The authors of the article [3] conducted research on the capabilities of microcontrollers and microcomputers. Conducted research by measuring ECG, pulse measurement, respiration measurement, EMG measurement, EEG measurement, bioimpedance measurement, skin temperature measurement, humidity determination, sweat analysis, and other biosignals using Arduino and Raspberry boards. According to the results of the research, the advantage of single printed circuit boards when measuring signals is their convenience. That is, it allows us to make measurements that take a long time without disturbing the patient’s comfort. According to the authors, the convenience of using microcontrollers and microcomputers is high, especially when it is necessary to collect certain data for a long time and to approve treatment measures based on it. But, according to the authors, in terms of low computing power and memory of single-circuit boards, disadvantages may be observed when compared with laptops and computers of the latest model.
In the proposed system of [9], an Arduino Uno-based system is used to administer the drug that controls the amount of anesthesia administered to the patient. The amount of anesthesia must be known in advance, that is, it is given as an input parameter for anesthesia control. And the Arduino Uno can be programmed to adjust this anesthesia dose. According to the results of the article, this system is very useful for anesthesiologists who monitor certain parameters of the patient and regulate anesthesia. The authors of this article [12] worked on a prototype consisting of a user interface, a control system, a central controller, and sensors. As a result, a health monitoring system that reads the frequency of pulse and body temperature has been successfully developed.
But, according to the authors, the main obstacle of this system is its cost. Implementation of the system is likely to suffer if a person is not motivated to manage their own health. Because the system is highly dependent on wide-area wireless communication infrastructure, access to the system is low in rural areas. In addition, the transmission or reception of this sensitive data over telecommunications networks may pose an information security problem. The authors of the article [13] studied a patient monitoring system consisting of Arduino Uno, temperature sensors, arterial sensor, pressure, heart rate sensor, motion sensors, buzzer, Bluetooth, Android phone, and power supply. According to the results of the study, the advantages of the system are that the system allows doctors to monitor the patient on the spot, monitor his vitals, and give them advice on !rst aid.
The authors of the article [17] used the Arduino Nano, programmed in Java, to control the servo motor as a research object. Thus, it was possible to perform operations written on Arduino without the help of any circuitry. The authors designed the robot in such a way that it can imitate the activity of a real human hand. The advantage of the robotic hand is that it allows a person to feel the actions of a real hand. However, instead of manually grounding the high-voltage system with the help of a robot-manipulator, it was concluded that the automatic connection of the highvoltage system could be dangerous.
The project of the authors [18] offered tools for automating the process of anesthesia administration using a syringe mechanism and an infusion set mechanism. The proposed system is a working prototype of the anesthesia delivery system. Also, the system consists of a database containing dosage values of drugs for various modes of operation. The automated system is ideal for both patients and doctors. But according to the authors, the biggest drawback is that if the operation time is too long, for example, in 5 hours, if it is not possible to introduce the full dose of anesthesia in one dose, it can lead to the death of the patient. The authors [19] individually investigated the various sensors connected to the Arduino boards. Heart rate sensor, temperature sensor, and ESP8266 tools connected everything to Arduino Uno to complete the research.
Studies have shown that the results were most accurate when the heat measurement was in the armpit or in the mouth. And heart rate data could be most accurately obtained if the receptor was located on the patient’s !nger or ear midge. Daily monitoring of patient data using such a system could give a good accumulated experience of knowledge and dataset, for further use in various situations, especially it would be indispensable in a pandemic. It is also important to note that very simple devices were involved in this study, which would not cope with very complex diseases in which more data on the patient’s condition is needed.
The system proposed by the authors in the research work [20] implemented a system with a high level of ef!ciency, which serves to monitor the patient’s lifecritical medical data. They compare the newly obtained data with the previous ones using sensors. Also, one of the most useful aspects based on the study of the authors is that when it sends the above information to the patient to the nearest hospital, a noti!cation is sent based on his location. According to the authors, this is noted in the fact that the system needs to be improved by adding temperature and ECG frequency sensors.
The authors [21] fully monitored the patient’s heart frequency, the state of the arteries by monitoring the functionality of the ATmega328 microcontroller, as a result of which access to data from anywhere showed good results. In their opinion, monitoring the use of Wi-Fi concluded that the overlap of frequencies in wireless networks with different radio technologies can create a complex situation, and the resulting interference can reduce the reliability of communication.
In this research paper [22], Arduino and Android devices were used to control the patient’s state. Here, information about the patient’s condition is obtained and sent to 2 separate interfaces, which are to display the patient’s data and store that data on a server, which doctors can monitor the patient’s data through the application on their Android phone.
Telemedicine is one of the most important and very necessary industries in our time. However, the implementation of such devices so that they can work with smartwatches and devices is a requirement of the time. In this research [23], a patient health monitoring system is presented, which utilizes the Arduino microcontroller and the things board web server. Multiple individual metrics are taken into account and collected, such as temperature, humidity, and other variables. The data from various sensors, which contains information about the patient’s health, is transmitted to a server accessible by doctors. Through this setup, medical professionals can continuously and remotely observe the patient’s well-being.
Scienti!c researchers [24] reviewed several articles and investigated the connection of Arduino UNO input pins with other Arduino UNO output pins. As a result, specialists came to conclusion that in case of an emergency, patients can easily review their reports and come to an appropriate decision, give recommendations, such a system automatically generates a map and informs the doctor about changes in the body of the patient and the necessary News. It was concluded that cloud computing is also useful for keeping patient information up to date. Cloud computing is also useful for keeping patient updates. But, according to the authors, this proposed machine should be further improved.
The authors of the [25] article took into account the shortage of oxygen ventilators during the pandemic and proposed an electronic machine made with Arduino that works like an oxygen ventilator. According to the results of the study of the system, the system is suitable for medical use for patients who cannot breathe voluntarily or have dif!culty breathing. It allows patients to be treated comfortably, however, as mentioned in the article, this machine is a portable system for emergency use only [25, 26]. proposed a smart sensor for measuring signals. The system is a prototype of advanced electronic components that use the national myRIO tool for intelligent data collection. Smart displays are designed as consumer products with smart sensors. In order to test the proposed monitoring system, four accuracy predictions of the physiological signals of the two users were calculated. In the experimental setting of the prototype, the average accuracy was obtained by 97.2%.
Studies [27, 28] consider the process of creating a system for use with patients with an intelligent module with an IOT element to monitor the patient’s condition online using heart rate, temperature, ambient temperature, and other important data sensors. For each speci!c situation, the percentage of errors in the prediction chain is within a certain limit (<5%) [29] considered the details of the reliability and safety of this system, a model was proposed using an intelligent module for the medical !eld using big data.
The paper [30] in order to provide an auxiliary diagnostic solution using smart phones, Holter had developed two wearable IHD detection platforms based on smartphones, which can collect and display ECG in real time, extract labels, and classify data, combining the portability of the monitor with the real-time processing power of the most advanced ECG equipment [31] and developed Android applications, providing suitable watches of different levels. Electrode pads or telemetry belts without wireless sensors made it effective to use it in health and health plans provided through mobile phones and additional tests required to determine its use in exercise-related exercises.
The authors of this article [32] explored the impact of a system with virtual reality built into it with musical effects. Next, modules with musical elements were studied, which affect the reduction of stress and depression. In this virtual environment with elements of the three-dimensional space of the real world and the corresponding accompanying music, relaxation and emancipation of the test subjects were observed. This system was aimed at patients who were in a coma. The system has built-in sensors for temperature control, heart control, SpO2 sensors, an eye pupil movement control sensor, CO2 control based on Arduino boards with the ability to send patient data to the cloud [33] in their scienti!c work considered a solution to the problem using the example of mini robots designed for home security. The robot uses ATMEGA2560 as a microcontroller to provide high clock speed and high clock speed due to the large amount of RAM and “ash memory. Therefore, compared with other microcontrollers, the implemented system can provide faster response [34] point out the importance of strengthening the integrated types of microcontrollers with big data. There is a large amount of research and related work in the !eld regarding the use of IoT in medicine. Another interesting application of microcontrollers in medicine is a device called AliveCor [35], which has a connection to a mobile device, with the ability to control an ECG, interpret an image, send a record to the attending physician, record anomalies that may be present in the image.
3 Materials and Methods
According to the Market Research Engine, the healthcare IoMT market will reach $158 billion by 2024. The IMT is being used in a wide variety of medical industries, where technology supports to remotely monitor patients and diagnose them more ef!ciently. People need convenient and useful digital technologies. In particular, according to Statista, user spending on the Internet of Things has doubled since 2017 and will grow another 6 times in the next !ve years. The big advantage of using this technology in the !eld of medicine is its wide prevalence and ease of use. Monitoring the condition of patients will probably always be an urgent problem all over the world. That is why the topic of remote control will also always be explored and studied with great enthusiasm. Even now, the modern development and research of this topic are gaining global momentum not only in the !eld of healthcare, but also in the !eld of IT.
The challenges of global health systems today, such as population aging and the rise of chronic and viral diseases, are forcing clinicians, healthcare providers, and governments to look to new technologies to deliver high-quality healthcare and reduce overall costs. Huge discoveries in the use of microcontrollers in healthcare, reduction of computing devices in size, improvement in the computing power of devices in medical installations every year lead to an increase in connected systems and sensors that can collect data, analyze the information received, process, transform, and broadcast them. The received data, together with sensors and microcontrollers, form a complete system of medical devices, software, and services. Microcontrollers are used as analogues of medical technology in the !eld of medicine. As a result, the ef!ciency of honey is growing. Personnel and processes in the workplace, especially in remote areas. The microcontroller is nothing new and has recently become increasingly relevant in industries such as energy, transportation, and healthcare. Taking advantage of connected healthcare solutions allows healthcare providers to monitor patients in real time by collecting, recording, and analyzing limitless information using microcontrollers. These are, in particular, patients whose physiological conditions requiring constant monitoring can be monitored using non-invasive monitoring controlled by a microcontroller. Thus, the use of sensors and microcontrollers reduces the workload of medical personnel who monitor the condition of patients, collect, analyze, and process data, and also provide a valuable opportunity not inherent in medical personnel, such as continuous monitoring.
Monitoring health status requires speci!c components, including an Arduino Uno board, ATmega328 microcontroller, Wi-Fi module ESP8266, LM35 temperature sensor, heart rate sensor, 10kΩ resistor, button, connecting wires, breadboard, and MicroSD card. The heart rate sensor, also known as a pulse sensor, is a userfriendly plug-and-play device that easily connects to the Arduino board. It can be worn on the !ngertip or earlobe and comes with an open-source heart rate monitoring application capable of graphing real-time heart rate data.
The heart rate sensor has a heart-shaped logo on its skin-contacting side, which also features a small round hole for the LED light to shine through. Below the LED is a light sensor, similar to those found in cell phones and laptops, used to adjust screen brightness under different lighting conditions. This sensor emits light toward the capillary tissue in the !ngertip, earlobe, or any other suitable body point, and the light sensor measures the re”ected light to determine the heart rate. To ensure measurement accuracy and prevent short circuits caused by sweat, it’s important to protect the exposed part of the sensor before use. The pulse sensor has three contacts: Signal (S) for the signal wire, Vcc (3–5 V) for the DC supply voltage, and GND (ground).
The LM35 temperature sensor is an analog linear sensor whose output is proportional to the temperature in degrees Celsius. It has an operating temperature range of −55 °C to 150 °C, and its output voltage changes by 10 mV per one-degree temperature change. The sensor can operate on both 5 V and 3.3 V supply voltage, and its rest current consumption is less than 60 μA. In this health monitoring setup, an ATmega328 microcontroller is used on the Arduino Uno board (Fig. 1). The ATmega328 is an 8-bit CMOS microcontroller based on the advanced AVR RISC architecture. The schematic diagram of the ATmega328 microcontroller is shown in Fig. 2 [36].
The microcontroller measures human data such as temperature, pulse, and pressure. All data is stored on a MicroSD card (Fig. 3). MicroSD card interface with Arduino board uses a microSD card module (SPI communication protocol). Six pins are used to connect the MicroSD card, and the interaction is carried out via the SPI interface. To connect the card, you need an ATmega328 microcontroller, a card module, and 6 wires. Arduino Uno data logging to MicroSD card is shown in Table 1.
Fig. 1 ATmega328 microcontroller on Arduino Uno board [36]
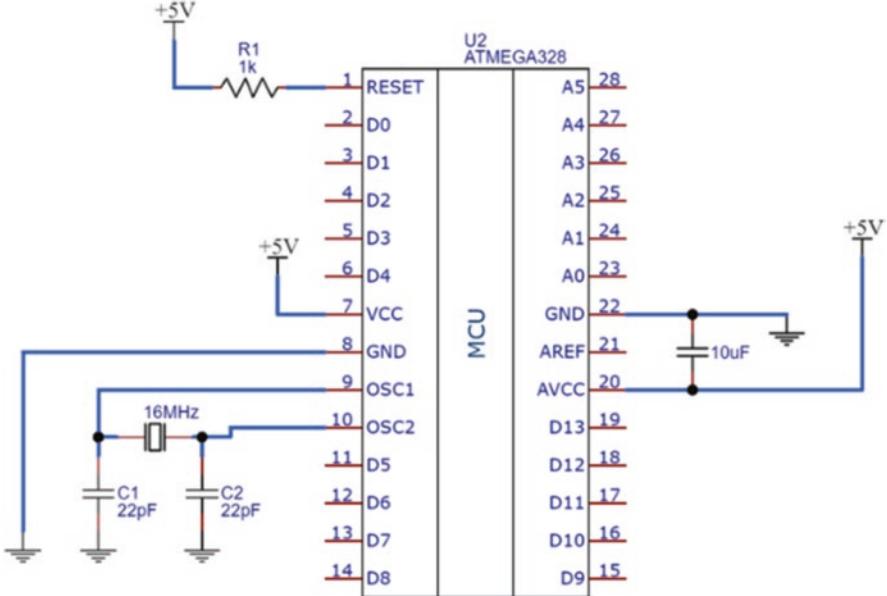
Fig. 2 Schematic diagram of the ATmega328 microcontroller
Fig. 3 MicroSD cards [33]
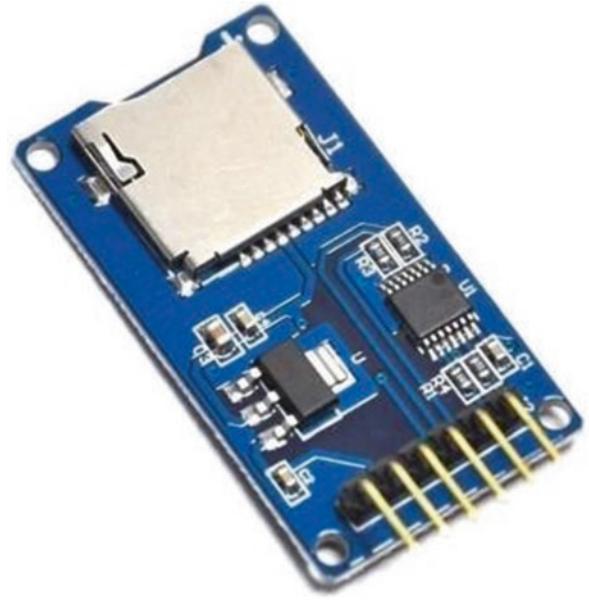
Table 1 Data logging Arduino Uno to MicroSD card module
| MicroSD card | Vcc | GND | CS | SCK | MISO | MOSI | |
|---|---|---|---|---|---|---|---|
| Arduino Uno | +5 V |
GND | 4 | 13 | 12 | 11 |
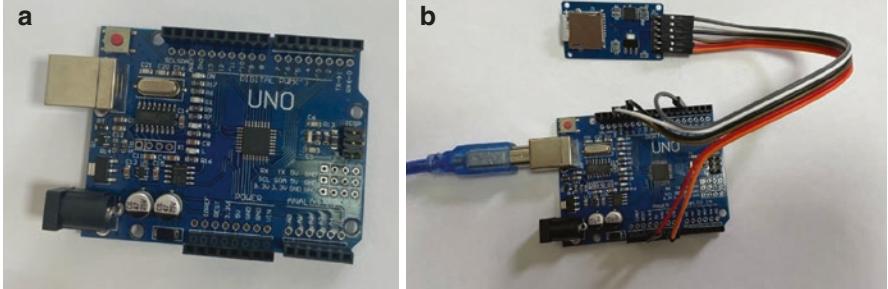
Fig. 4 MicroSD card module connects to the ATmega328 microcontroller
Digital I/O is connected as follows: MOSI and MISO pins on Arduino Uno board D11, SCK to D13, CS to 4, VCC to +5 V, GND to GND. The board has connectors connecting to 3.3 and 5 volts. The microSD card’s power supply is 3.3 volts, so you need to use a microcontroller with the same power supply, otherwise voltage level converters are needed. SD and microSD cards (Fig. 4) can signi! cantly expand the capabilities of Arduino projects that work with large amounts of data: data loggers, weather stations, and smart home systems. The Arduino boards are equipped with a relatively small internal memory, only up to 4 kilobytes, including both “ash memory and EEPROM. This memory will not be enough to write large amounts of data, especially if the board is constantly turning off or off. Connecting an Arduino SD card as an external drive allows you to multiply the storage space for any information. Removable SD drives are cheap, easy to connect, and easy to use.
The diagram for writing data to a SD card using a microcontroller was implemented in the Fritzing software utility. The type of connection is a simple scheme since all modules were combined on 1 board. On the next Fig. 5 shows how this type of connection is implemented.
The ESP8266 microcontroller is used as a Wi-Fi, as it has a Wi-Fi technology module embedded in it (Fig. 6).
The scheme of the patient health control technology based on the Arduino board is presented in the following Fig. 7. The program uses a special library for working with the pulse sensor Pulse sensor Playground. Timer.h is also used to set the time interval between data readings. First of all, all used libraries must be connected to the program. Serial communication library (software serial) is used for interaction with esp8266. Next, the ability to use low-level interrupts to increase the accuracy of measurements and enable DEBUG to display incoming commands in the serial monitor window is initialized. Then in the program you need to enter the name of your Wi-Fi connection, the password to connect to it and the IP service.
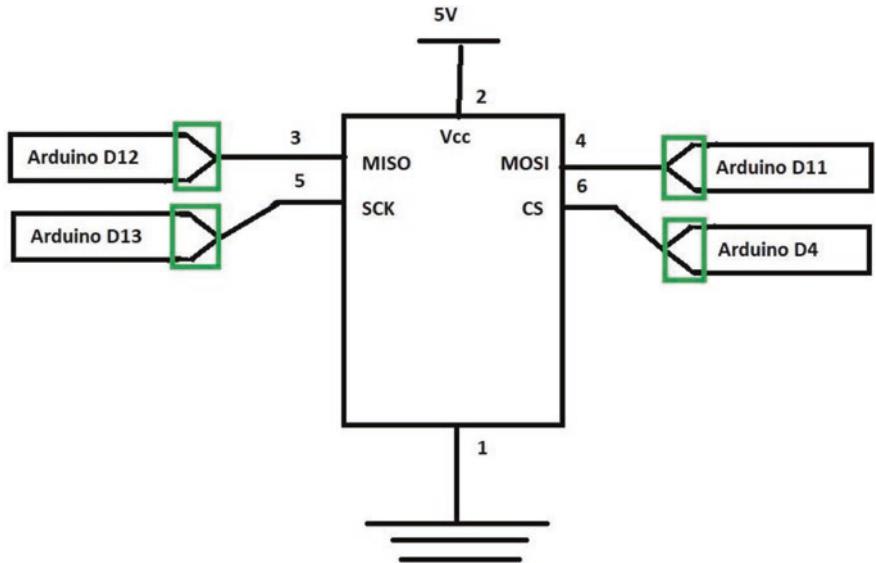
Fig. 5 ATmega328 microcontroller schematic diagram
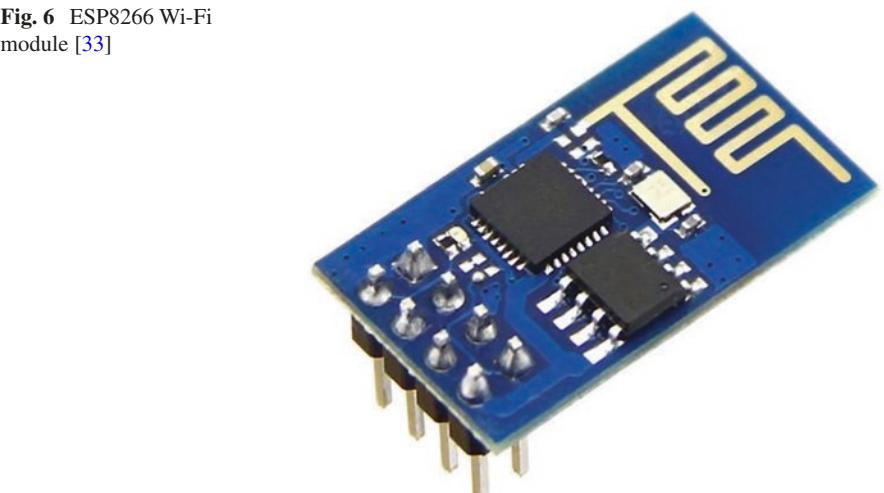
The setup function establishes the baud rate for serial communication between the Arduino serial monitor and the esp8266 module. To initiate the esp8266 module, we issue the appropriate command and connect it to the Wi-Fi network by calling the connectWiFi() function. Subsequently, we set up the timer by invoking the t.every(time_interval, do_this) function, which determines the interval for reading data from the sensor.
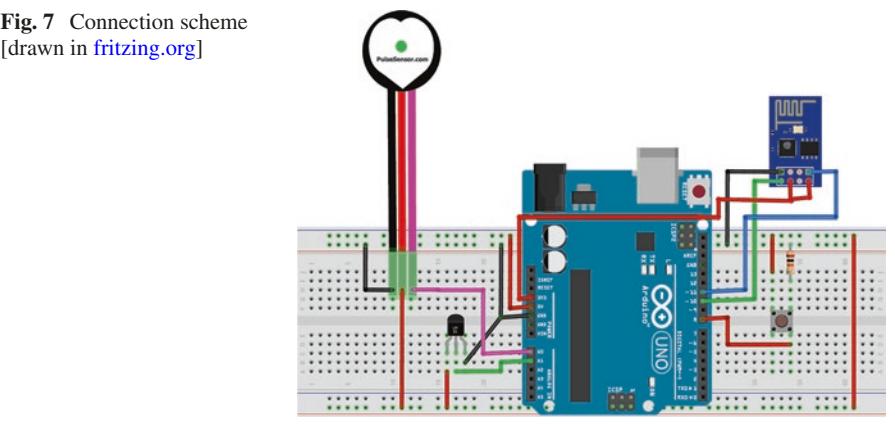
Additionally, within the program, we need to de!ne the functions connectWiFi(), panic_button(), update_info(), and getReadings(). The connectWiFi() function returns a True or False value based on whether the module successfully connects to the Wi-Fi network. The command AT+CWJAP = 1 instructs the ESP8266 module to function in station mode, while the AT+CWJAP = command facilitates the connection to our Wi-Fi access point. The getReadings() function reads data from the pulse sensor and the temperature sensor LM35, converting them into strings using the dtostrf() function. To store BPM (beats per minute) and temperature values, we initialize a character array and then convert the sensor outputs into strings using the dtostrf() function [37].
3.1 Project Testing
To conduct the test, it is necessary to combine the physical details of this project, and then install the program on the board. To check and run the program, you need to open the display window.
In the scheme, it is necessary to make the following connections:
- Signal contact pulse sensor > contact A0 board Arduino;
- Contact Vcc sensor pulse > 5 V board Arduino;
- Contact GND sensor pulse > GND board Arduino;
- Vout sensor LM35 > contact A1 board Arduino;
- Tx module ESP8266 > contact 10 board Arduino;
- Rx module ESP8266 > contact 11 board Arduino;
- CH_PD and Vcc module ESP8266 > 3.3 V board Arduino;
- GND module ESP8266 > GND board Arduino.
Essential components for monitoring students’ health status are saved in the MicroSd card module (Fig. 8).
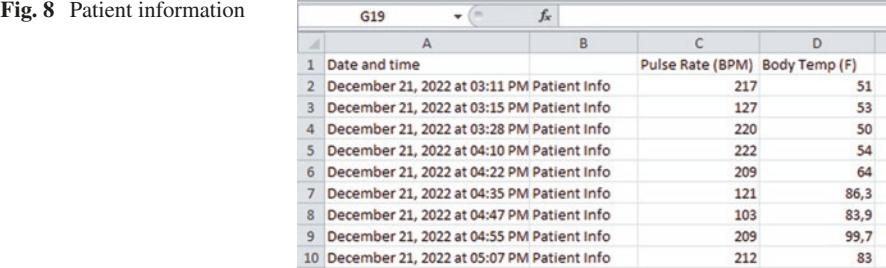
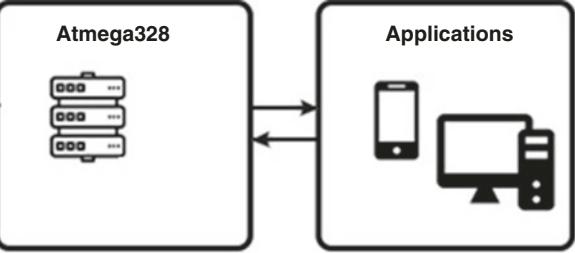
The stored health data of patients on the MicroSD card connects via the COM port to the application. Students’ health status can be viewed on the computer. Transfer of patient information to applications shows in Fig. 9.
4 Results
This paper describes the content of the experience of using the Arduino device and evaluates the effectiveness. Ef!cacy was assessed by a survey among patients using this intelligent system. Pre-processed and collected data from various sources make it possible to adequately evaluate the intelligent system in terms of the following parameters: patient satisfaction, reliability, usefulness.
In December 2022, patients using this intelligent system were asked to complete an online questionnaire through the google disk platform. The questionnaire was completed by 150 participants. 21.3% of participants—patients registered with cardiologists with severe forms of cardiovascular disease (n = 32), 12%—with signs of high blood pressure (n = 18), 46.6%—patients with chronic kidney disease (n = 70), and 20% are healthy patients. (n = 30). These study participants were registered at Polyclinic No. 30 in Almaty. Most of the participants were trained in the use of this device beforehand. Written consent for the use of these survey results for scienti!c purposes was obtained from all participants prior to completing the questionnaire. It was agreed that the empirical data collected would be used for research purposes only and that the questionnaire did not include any questions regarding patients’ personal data, gender, age, and address. At the beginning of the questionnaire,
information is given about the objectives of this study and a guarantee of anonymity. The !rst group of questions was aimed at !nding out the knowledge of the use of this device, and how this device was useful to them. There was an item for patients to ask if they were not using the device for any purpose. If this question received an af!rmative answer, the next question was on a Likert scale with an assessment of the usefulness of this device.
The second group of questions is devoted to assessing the patients’ perception of the support of this device as an independent recommender device that can be used without a doctor. Participants used a 10-point scale to answer this question. The third group of questions contains 10 questions aimed at measuring patient satisfaction with this system. For each question, a 5-point assessment was used with responses ranging from “not satis!ed at all” to “completely satis!ed.” In the last group of questions, patients had the opportunity to write their comments and opinions about the intellectual system, suggestions for improvement. To compare and analyze the results of the survey, we use parametric statistics. Parametric tests are commonly used on normally distributed data. Student’s test and analysis of variance (ANOVA) is one of the most popular. Data normality was checked by kurtosis and skewness indices.
According to the data in Table 2, it can be seen that the deviation from the norm of asymmetry and kurtosis are small, it can be assumed that this distribution is close to normal.
| Parameter | Items | Asymmetry | Excess | Cronbach’s alpha |
Average dispersion |
Reliability | |
|---|---|---|---|---|---|---|---|
| Without a device with a doctor |
Advisory and consulting support |
3 | −0.101 | 0.093 | 0.97 | 0.51 | 0.91 |
| Interaction and cooperation |
2 | −0.033 | 0.305 | 0.89 | 0.56 | 0.89 | |
| Independence | 1 | −0.599 | 0.312 | 0.79 | 0.58 | 0.88 | |
| Stress reduce effect |
5 | −0.425 | 0.218 | 0.82 | 0.50 | 0.88 | |
| With device |
Advisory and consulting support |
3 | −0.203 | −0.499 | 0.96 | 0.52 | 0.95 |
| Interaction and cooperation |
2 | 0.100 | −0.960 | 0.89 | 0.59 | 0.92 | |
| Independence | 1 | −0.932 | 0.456 | 0.79 | 0.51 | 0.85 | |
| Advisory and consulting support |
4 | 0.203 | −0.968 | 0.98 | 0.56 | 0.89 | |
| Stress reduce effect |
5 | −0.94 | 0.512 | 0.86 | 0.55 | 0.98 |
Table 2 Rates of skewness and kurtosis of factors, scale validity using Cronbach’s alpha for 150 data
The distribution skewness is the ratio of the central moment of the third order to the cube of the standard deviation:
\[as = \mu 3 / \sigma 3\]
The kurtosis (or kurtosis coef!cient) of a random variable is a number:
\[\text{es} = \mu 4 / \sigma 4 - 3\]
The number 3 is subtracted from the ratio because for the most common normal distribution, the ratio μ4/ 4 = 3. In addition, the amount of statistical power increases due to the decrease in the size of the sampling error. The large sample size and the skewness and kurtosis indices make it possible to conclude that the data are normally distributed and suitable for parametric analysis. Each dimension, namely advisory support, interaction and collaboration, device autonomy, and patient satisfaction, was assessed for cohesion. Each questionnaire scale is represented by Cronbach’s alpha coef!cients. These coef!cients “uctuate between 0.79 and 0.98, which is an excellent indicator. The mean variance and reliability index were also calculated. For each parameter, the average dispersion coef!cient is higher than 0.50, and the reliability indicators are not lower than 0.85, which can be used to conclude that the presented scales are reliable.
To evaluate the advantages and disadvantages of the developed system, 150 responses from the participants in this experiment were analyzed. As shown in Fig. 10, the most useful module of the system is the availability of the device anywhere and at any time, this item was preferred by almost 28% of all respondents. Many patients noted that this factor plays a key role in reducing stress. One patient commented: “This system is available anytime, anywhere, no need to make an appointment and wait” (Availability anytime, anywhere). Another survey participant commented: “There is no need to go to the doctor and waste time on this” (Saving travel time). Another 50% of respondents noted: “There is no need to sit in line to see a doctor.”
With regard to the convenience and ease of use of this device, 23 patients noted this factor as the most important. Also, the speed of work and the ability of the
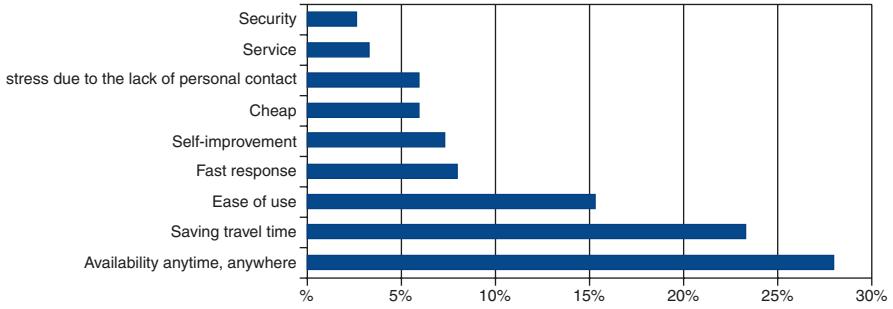
Fig. 10 Priority parameters for respondents
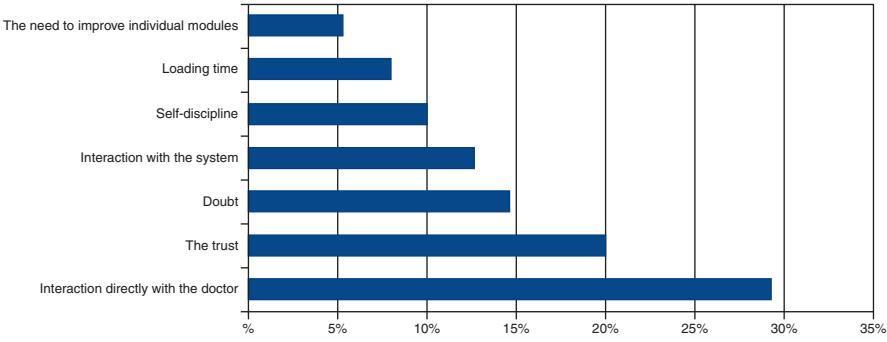
Fig. 11 Negative parameters for respondents
system to self-improve were noted by 12 and 11 respondents, respectively. 6% of respondents responded positively about the price. The absence of the need to communicate with other people and, accordingly, the possibility of avoiding stress in this way were noted by 9 patients. The security and maintenance of this system did not go unnoticed by the participants in this experiment, and 3% of the respondents noted these items as a priority.
The next Fig. 11 shows the negative aspects for the respondents.
More than 29% of the respondents expressed their unwillingness to interact directly with the doctor, although 10% of the respondents did not see anything of the kind in this and gave estimates in favor of this parameter. 20% and 15% expressed disbelief and doubts about the system, although these same participants noted the convenience, ease of use, safety, and stress reduction. 13% of respondents had problems directly interacting with the system, the main reasons for such problems were technical problems with the cable and microcontroller, communication interference. For the timely use of the device, self-discipline is also necessary, which 10% of the respondents could not show. Most of these 10% noted and recommended building a reminder module with a call or noti!cation into the system. Boot and turn on time of the system usually did not take more than 15 seconds, however, 12 patients had problems with booting and this problem was again due to technical problems of the microcontroller, which were later corrected. A very small number of respondents, about 6%, recommend improving the system by integrating additional functions into it for recommendations and consultations, and improvements in design.
5 Conclusion
The almost complete introduction and use of the latest technologies such as the Internet of things, big data, and arti!cial intelligence in the healthcare sector have seen a revolution in the development of methods and methods of treatment, thereby developing medicine in a new direction. The covid period, which showed the importance of remote monitoring and treatment of people (IoMT) [38], developed these areas with unprecedented speed and zeal. Round-the-clock monitoring of the patient’s condition and well-being without any special psychological and external in”uences and contacts at this time is also a problem requiring great attention. In this regard, the use of robotic systems simpli!es the solution of this problem. Various devices developed on the Arduino platform help to automate the acquisition of data on the patient’s condition such as measuring physical activity, heart rate, blood pressure, and online pulse pressure are very important for medical staff to quickly respond and take action. High-quality and prompt provision of medical care is always an urgent problem that requires special attention. With the advent of intelligent healthcare, doctors as well as patients can monitor, access, analyze data, and provide proper medication if any problem occurs from their location without the need to travel (R.Anandh, 2018). In the use of IoT technology, it is important to note the issue of security, which is important to always consider. Personal data hacking and information leakage from the cloud (G. Yamini, 2020) with medical data are especially dangerous for the medical profession.
In smart cities, intelligent healthcare systems extensively utilize IoMT sensors to monitor the health of patients. These sensors are designed for human use and include smart thermometers for tracking body temperature, Q-bands for assessing user mobility, and pacemakers integrated with medical alert systems to offer continuous monitoring and prompt alerts during cardiac emergencies. Moreover, proximity tracers are instrumental in identifying possible clusters of new contagious diseases. Additionally, temperature sensors are employed in hospitals to oversee plasma storage, providing valuable resources for future studies. These medical sensors exemplify some of the many devices accessible for monitoring citizens’ well-being.
Implementation of data collection, a system module will be created that includes the following functions: data storage, anomaly !xation, receiving data from the Arduino sensor, smart watches and bracelets, sending signals to the treating staff, monitoring the patient’s condition, and predicting the development of the disease. This article discusses the methodology for using an automated heart rate monitor for effective patient care and health monitoring. This system is very easy to use and designed with minimal hardware to be ef!cient.
Currently, one of the most pressing issues is the promotion of the innovative use of the Internet of things in medicine and healthcare and the acceleration of the integration of medicine and healthcare with information technology. With the help of innovative applications such as online data monitoring, sensor-based positioning, and monitoring, intelligent development is being achieved with high performance in areas such as medical management, telemedicine, and hierarchical diagnostics. The Medical Internet of Things helps to provide remote services to patients in real time and improve communication between them and healthcare facilities. As a result, the huge amount of data generated by the Internet of Things in the !eld of medicine and wellness provides an informational basis for the development of predictive, preventive, personalized, and participation-based drugs. Connected medical devices and the Medical Internet of Things can solve several challenges facing the global healthcare industry today. Despite rising treatment costs, turbulent regulatory environments, and changing reimbursement models, the Medical Internet of Things is still
expected to improve patient care, improve healthcare outcomes, and reduce the cost of the entire system. This is why the healthcare industry urgently needs the Medical Internet of Things. The COVID-19 pandemic has doomed many to change their minds about the use and integration of information and communication technology tools under quarantine. In this study, the use of these funds was analyzed using a survey of participants who took part in this study, and these were patients of the clinic in Almaty (Kazakhstan). The responses to the survey made it possible to evaluate the pros and cons of using this system, identify future work`, and clarify improvements in the operation of this system.
References
- Chandana R, Kaveen V, Gajalakshmi M, Manisha SJ. Automatic anesthesia control system. Int J Eng Appl Sci Technol. 2021;5(9):247–9.
- D’Ausilio A. Arduino: a low-cost multipurpose lab equipment. Behav Res Methods. 2011;44:305–13.
- Ehrmann G, Blachowicz T, Homburg SV, Ehrmann A. Measuring biosignals with single circuit boards. Bioengineering. 2022;9:84. https://doi.org/10.3390/bioengineering9020084.
- Sundaram P. Patient monitoring system using android technology. Int J Comp Sci Mob Computing. 2013;5:191–201.
- Rahimunnisa К, Atchaiya М. AI-based smart and intelligent wheelchair. J Appl Res Technol. 2020;18:362.
- Lambat MM, Wagaj SC. Review: health monitoring system. Int J Sci Res. 2015;4:246–50.
- Balakayeva GT, Darkenbayev D. The solution to the problem of processing big data using the example of assessing the solvency of borrowers. J Theor Appl Inf Technol. 2020;98(13):2659–70.
- Balakayeva GT, Phillips C, Darkenbayev DK, Turdaliyev M. Using NoSQL for processing unstructured big data. News Natl Acad Sci Repub Kazakhstan Ser Geol Tech Sci. 2019;6(438):12–21.https://doi.org/10.32014/2019.2518-170X.151.
- Gokilavani R, Gokulapriya M, Jasmine Christy AR, Jeeva R. Anesthesia control system with multi sensor using Arduino. Int J Innov Res Adv Eng. Mar 2019;6(03):86–90.
- Aalan Santhosh B, Sujatha S. Securing and monitoring human health using Arduino Mega and sensors. Int J Electron Commun Technol. 2018;9(4):9–12.
- Akhmed-Zaki DZh, Mukhambetzhanov ST, Nurmakhanova ZM, Abdiakhmetova ZM. Using wavelet transform and machine learning to predict heart !brillation disease on ECG. SIST 2021–2021 IEEE international conference on smart information systems and technologies, 2021. https://doi.org/10.1109/SIST50301.2021.9465990.
- Kale K, Dighe S, Dhakad T. Development of health monitoring system. Int J Eng Appl Sci Technol. 2019;4(6):72–6.
- Keertirani, Ashwini S, Asha M, Aishwarya R, Sudharshan KM, Kumar CSA. Implementation of patient monitoring system using Arduino UNO. Int J Adv Res Sci Eng. 2018;07:118–23.
- Oganov RG, Kontsevaya AV, Kalinina AM. Economic burden of cardiovascular disease in The Russian Federation. Cardiovasc Ther Prev. 2011;10(4):4–9. https://doi.org/10.1582 9/1728-8800-2011-4-4-9.
- Kontsevaya AV, Balanova YA, Imaeva AE, Khudyakov MB, Karpov OI, Drapkina OM. “Economic burden of hypercholesterolemia in The Russian Federation”, rational pharmacotherapy in cardiology. 2018;14(3):393–401. https://doi.org/10.20996/1819- 6446-2018-14-3-393-401.
- Anandh R, Indirani G. Real time health monitoring system using Arduino with cloud technology. Asian J Comput Sci Technol. 2018;7(S1):29–32.
- Rajashekar K, Hanumantha R, Ruksar Begum TK, Begum S, Fathima SZ, Kauser S. Robotic arm control using Arduino. J Emerg Technol Innov Res. 2020;7(6):453–5.
- Ramya T, Shajugeorge B. IoT based Anaesthesia injector. Int J Eng Sci Comput. 2020;10(3):24854–7.
- Richa D, Kushwaha AK, Sreejeth M. An IoT based health monitoring system using Arduino Uno. Int J Eng Res Technol. 2021;10(03)
- Sheta MAE, El-Adly RAE, ElAl! AEE. Developing smart system for managing heart patients’ crises. Res J Educ. 2022;67:313–46.
- Sivasankari N, Parameswari M, Anbarasan K, Moses MB. Arduino based human health care monitoring and control system. IOSR J Electr Electron Eng. 2016;11(3):09–18.
- Sneha Sravanti D, Srivalli M, Srilakshmi S, Sneha Mol PS. Personal health monitoring system using Arduino and android. Int J Eng Res Technol. 2016;4(22):1–5.
- Sunehra D, Siddireddygari S. Patient health monitoring system using Arduino Mega 2560 and Thingsboard server. Int J Sci Technol Res. 2020;9(03):5020–6.
- Unawane S, Jadhav S, Jagtap S. E patient monitoring system using Arduino. Int Res J Mod Eng Technol Sci. 2021;03(07):1498–505.
- Pravin Yele S, Kaustubh Ahire B, Rakesh Nagpure R, Chetan Chaudhary P, Yogesh Chaudhari P. “Health monitoring system with ventilator using Arduino”, international journal of scienti!c research. Sci Technol. 2022;9(3):784–90.
- Gulzat T, Lyazat N, Siladi V, Gulbakyt S, Maxatbek S. Research on predictive model based on classi!cation with parameters of optimization. Neural Network World. 2020;30(5):295–308. https://doi.org/10.14311/NNW.2020.30.020.
- Jeyaraj PR, Nadar ERS. Smart-monitor: patient monitoring system for IoT-based healthcare system using deep learning. IEEE J Res. 2019;68(2):1435–42.
- Berdaly Z, Abdiakhmetova ZT. “Comparative machine-learning approach: study for heart diseases”. SIST 2022–2022 International conference on smart information systems and technologies, proceedings, 2022. https://doi.org/10.1109/SIST54437.2022.9945705.
- Islam MM, Rahaman A, Islam MR. Development of smart healthcare monitoring system in IoT environment. SN Comput Sci. 2020;1:185.
- Riazul Islam SM, Daehan Kwak MD, Kabir H, Hossain M. The internet of things for health care: a comprehensive survey. IEEE Access. 2015;3:678–708. https://doi.org/10.1109/ Access.2015.2437951.
- Joseph Oresko J, Jin Z, Cheng J, Huang S, Sun Y. A wearable smartphone-based platform for real-time cardiovascular disease detection via electrocardiogram processing. IEEE Trans Inf Technol Biomed. 2010;14(3):734–40. https://doi.org/10.1109/TITB.2010.2047865.
- Matthew Gregoski J, Mueller M, Vertegel A, Alexey S, Brenda Jackson B. Development and validation of a smartphone heart rate acquisition application for health promotion and wellness telehealth applications. Int J Telemed Appl. 2012;2012:696324. https://doi. org/10.1155/2012/696324.
- Lin X, Mahmud S, Jones E, Shaker A, Miskinis A, Kanan S, Kim J-H. Virtual reality-based musical therapy for mental health management. In: 2020 10th Annual computing and communication workshop and conference (CCWC). IEEE; 2020. p. 948–52.
- Yaashuwanth C, Pachaiyappan P, Gopinath C. Smart home security surveillance robot using ATMega 2560 microcontroller. Int J Soft Comput. 2020;11(8):310–8.
- Yin Y, Zeng Y, Chen X, Fan Y. The internet of things in healthcare: an overview. J Ind Inf Integr. 2018;1:03–13.
- Temirbekova ZE, Pyrkova AY. Improving teachers’ skills to integrate the microcontroller technology in computer engineering education. Educ Inf Technol. 2022;27(6):8381–412. https:// doi.org/10.1007/s10639-021-10875-8.
- Temirbekova Z, Pyrkova A, Abdiakhmetova Z, Berdaly A.Library of fully homomorphic encryption on a microcontroller. SIST 2022–2022 International conference on smart information systems and technologies, proceedings, 2022. https://doi.org/10.1109/SIST54437.2022.9945722.
- Pasluosta F, Gassner H, Winkler J, Klucken J, Esko!er BM. An emerging era in the management of Parkinson’s disease: Wearable technologies and the Internet of Things. IEEE J Biomed Health Inform. 2017;19(6):1873–81.